Overview
You can use the DataEditor to create machine learning models and make predictions with data stored in the DataEditor.
The DataEditor currently supports the following types of models:
| Model | Explanation |
|---|---|
| Regression |
This model predicts for numerical values. Example use cases include using weather/day of the week data to train a model to predict for customer or sales numbers. |
| Classification |
This model classifies data into categories. Example use cases include predicting whether credit care usage is normal or fraudulent and predicting which users are likely to register for membership campaigns. |
| Clustering |
This model groups data into a set number of clusters based on similarities. It can be used for things like market analysis and computer vision. |
There are two types of classification and regression models that you can create: ones made with the Model Generator and one made without the Model Generator.
Models created with the Model Generator can be used to solve more complicated problems, but as a result, training the model takes a longer time. Models created without the Model Generator can be trained more quickly, but are more suited for simple problems.
We’ll refer to models created with the Model Generator as “Model Generator versions” to distinguish them.
Some advantages to using the DataEditor machine learning features include:
- All you need to do is create your data in the DataEditor. No difficult machine learning expertise required.
- You can prepare your training data, create a model, and evaluate your model all within the DataEditor.
Regression model (Model Generator version) example
This section will use the electricity demand data from Demand forecasting with the regression model to demonstrate how to create a regression model (Model Generator version) from the DataEditor:
Preparing the data
We’ll start by preparing the data we’ll use to train and test the model, which is the same data used in the Demand forecasting with the regression model tutorial.
If you haven’t followed followed that tutorial and need to prepare the data, complete the steps in the Preparing the data as a CSV file and Splitting the data in the DataEditor sections.
Creating the model
Once your training data is ready, create the model by doing the following:
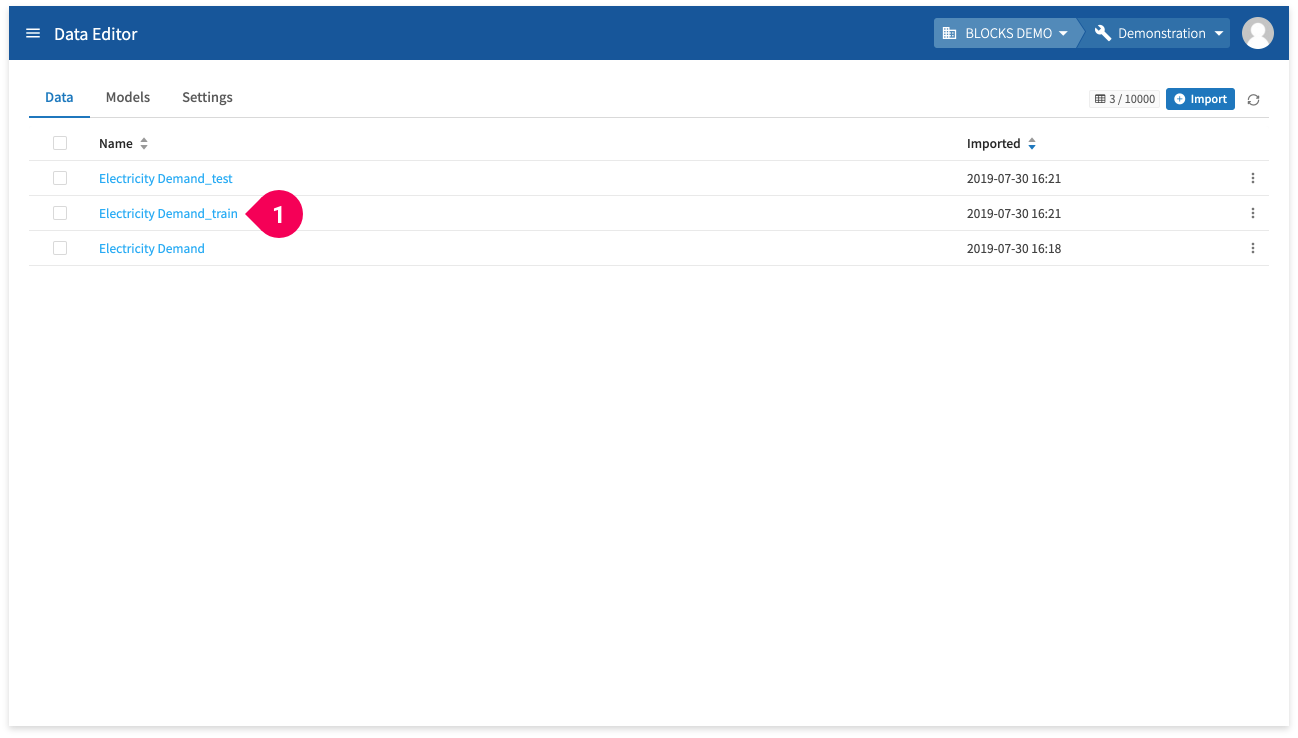
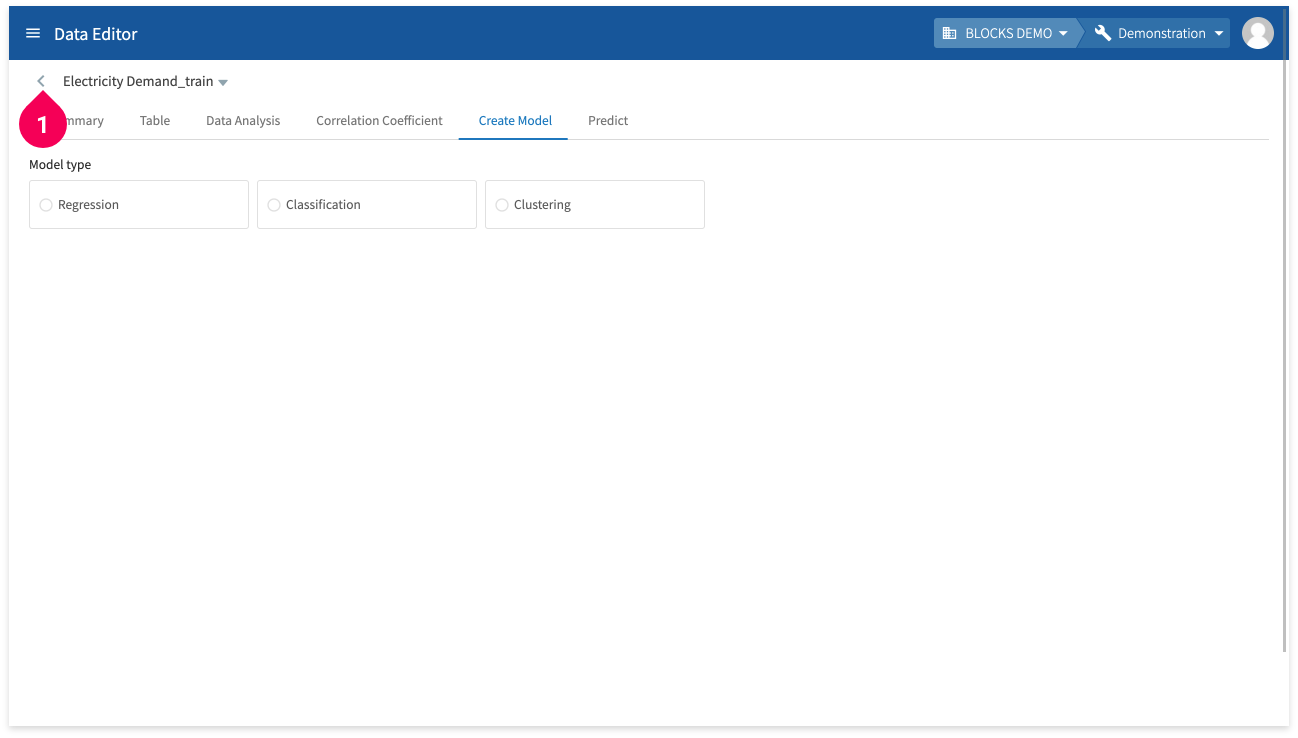
- Click Electricity Demand_train.
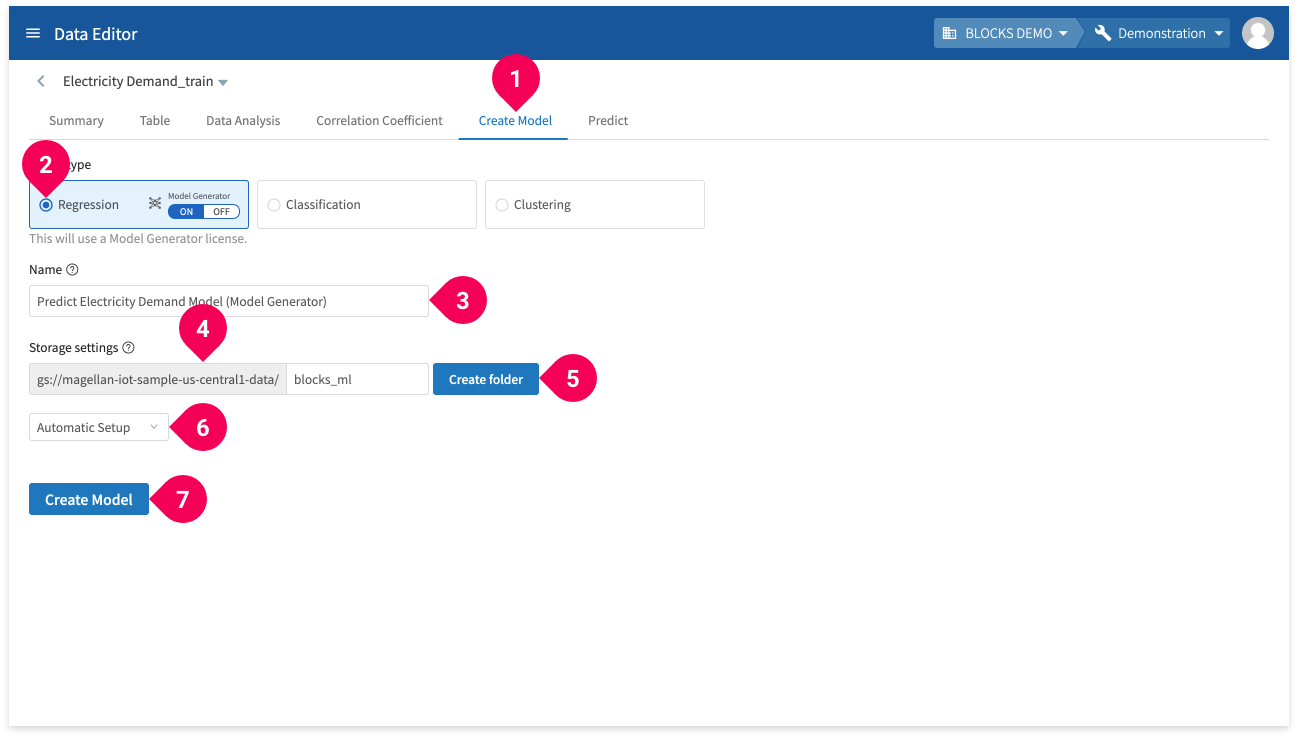
- Click Create Model.
- Click Regression.
- Enter a name for the model.
- Designate the Google Cloud Storage (GCS) folder that will store your models (only if it’s the first time you are creating a Model Generator).
- Click Create Folder (only if it’s the first time you are creating a Model Generator).
- Select Automatic Setup or Manual Setup:
- Automatic Setup: Automatically sets the maximum time until timeout to 30 minutes and the maximum number of trials to 20.
- Manual Setup: Allows you to configure the the maximum time until timeout, maximum number of trials, and training data settings before creating the model.
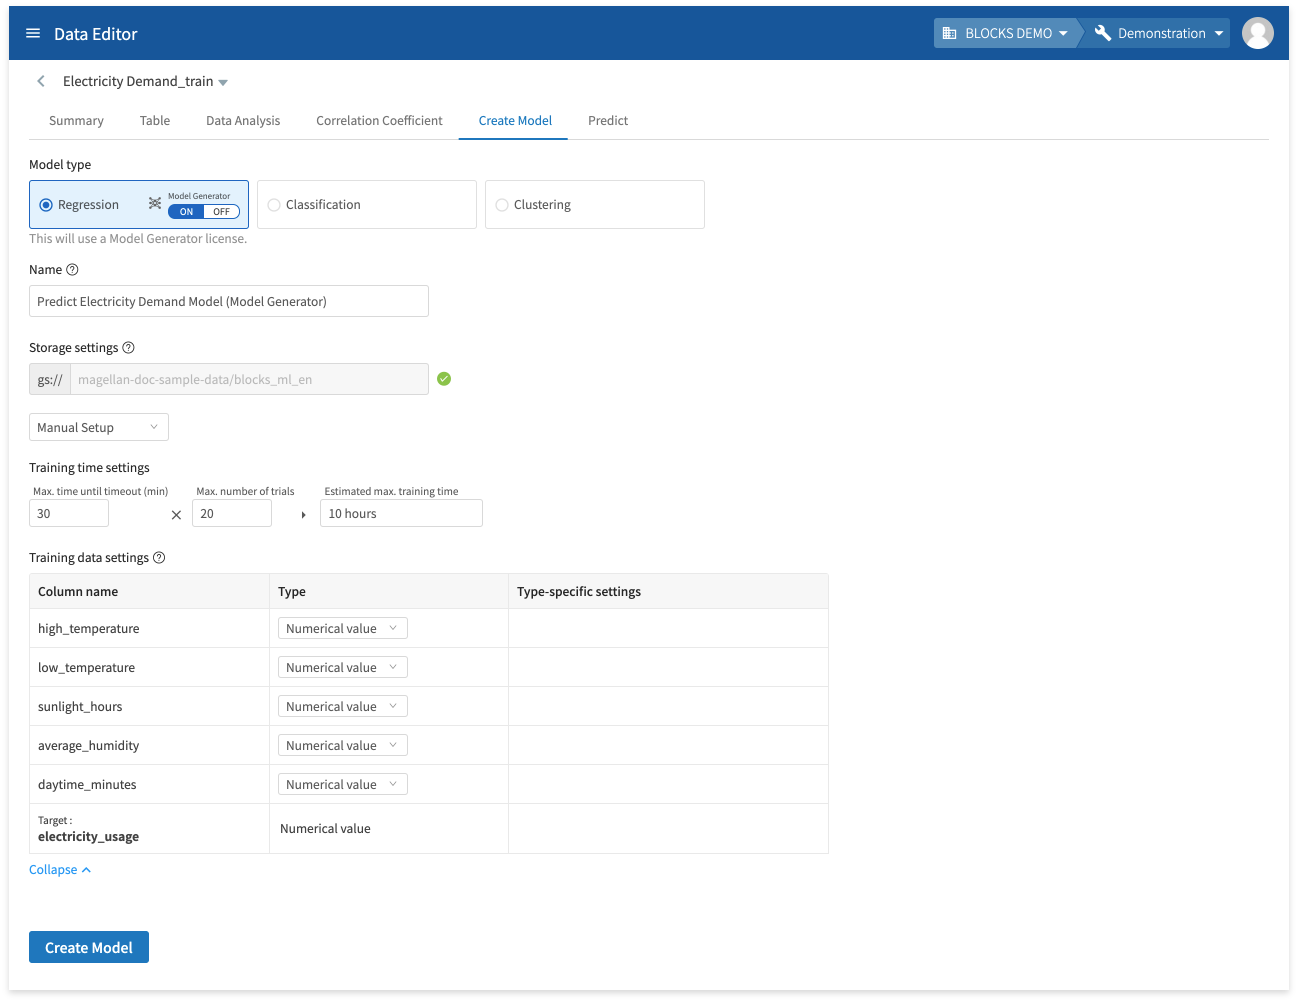
info_outline The training may stop itself before the maximum time before timeout if its results worsen drastically. The actual training time may differ from the estimated maximum training time.
- Click Create Model.
You can check on the progress of the model’s training by doing the following:
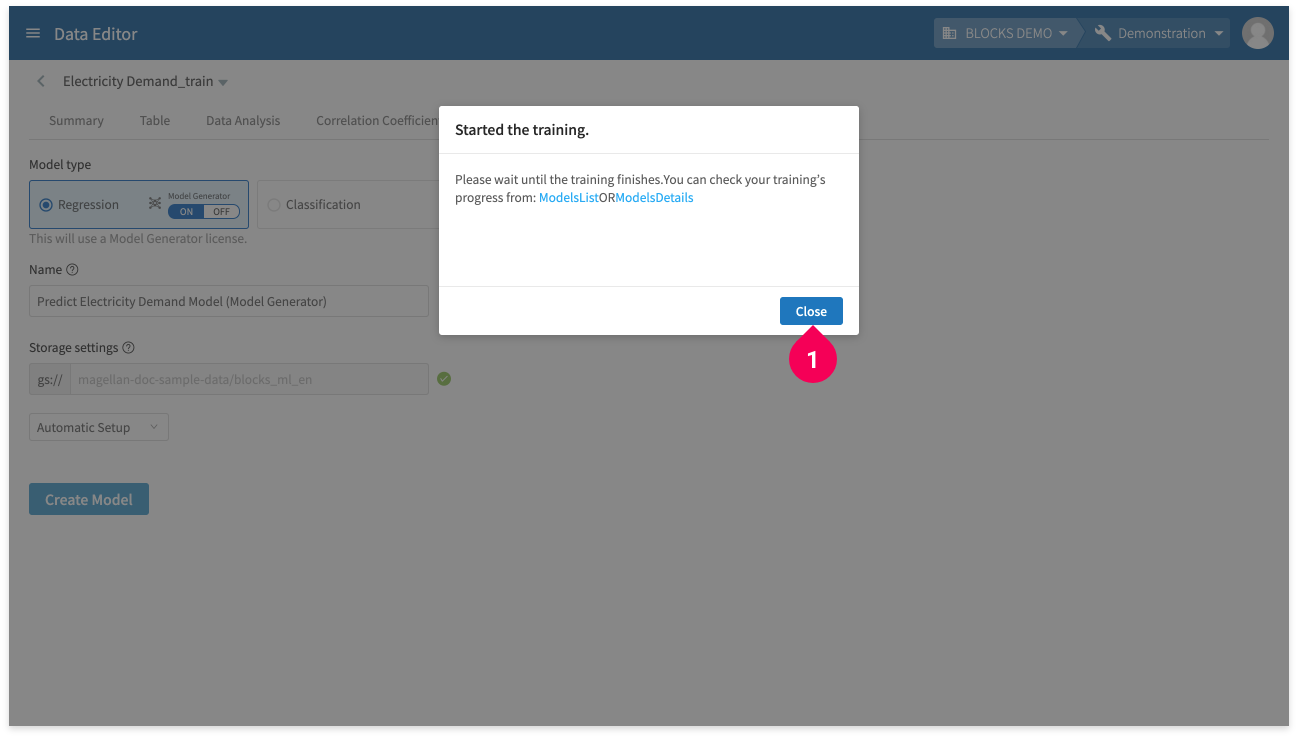
- Click Close.
- Click <.
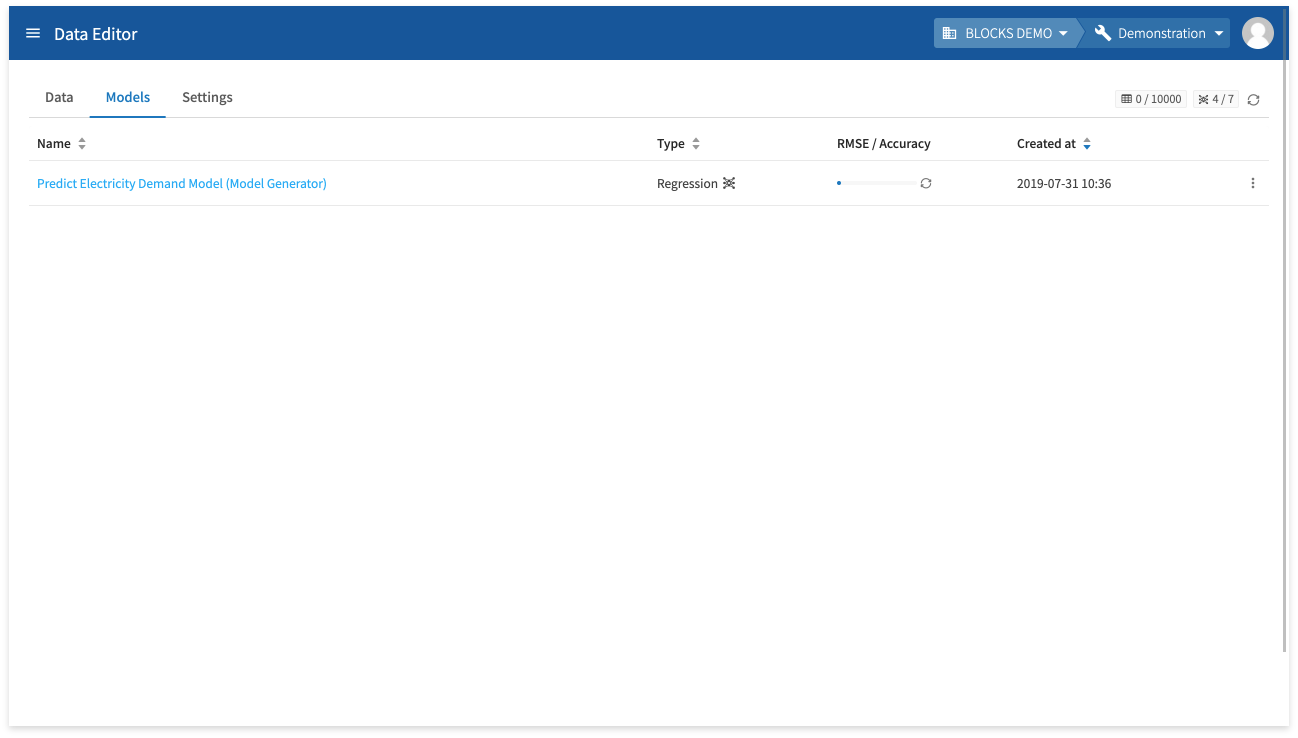
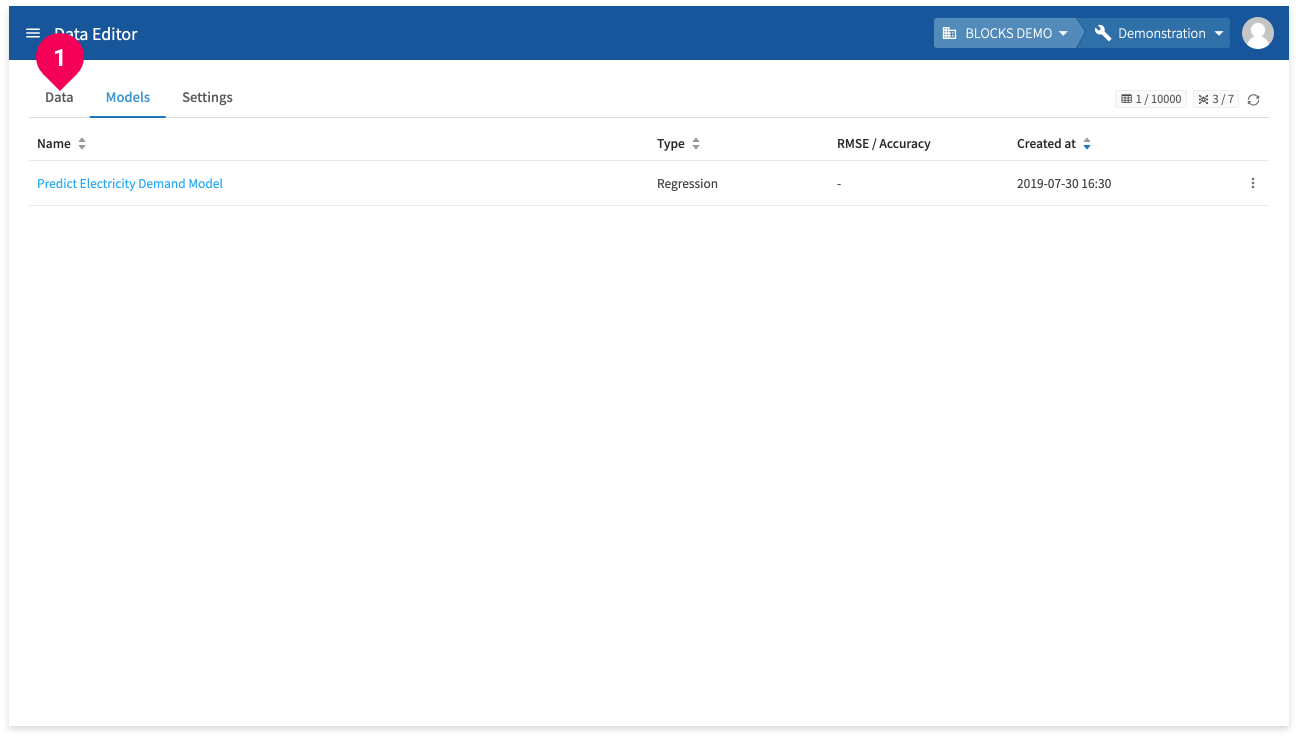
- Click Models.
- View the progress bar to see the training’s progress.
- Click the refresh icon to refresh the progress bar.
- Click the name to view the model’s details page.
The following is an example of a model’s details:
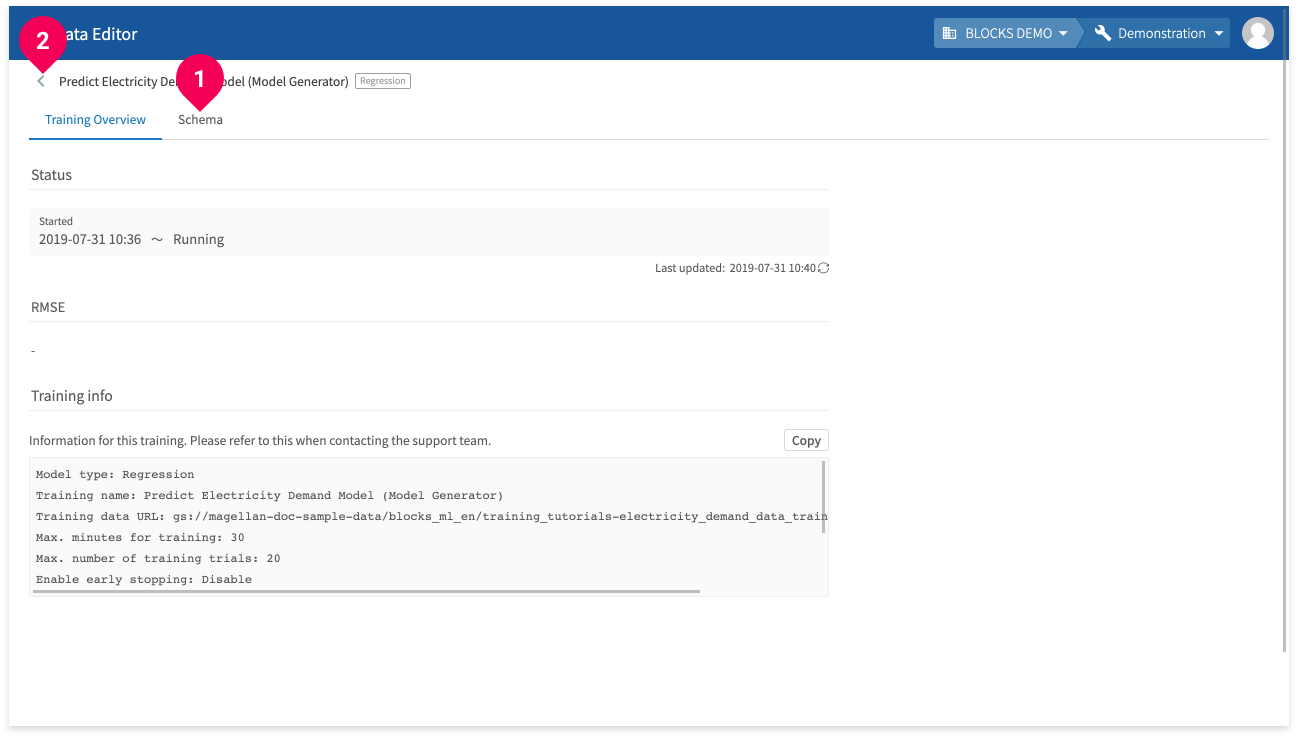
- In the Schema tab, you can view the model’s schema information (column names and types).
- Click < to return to the model list.
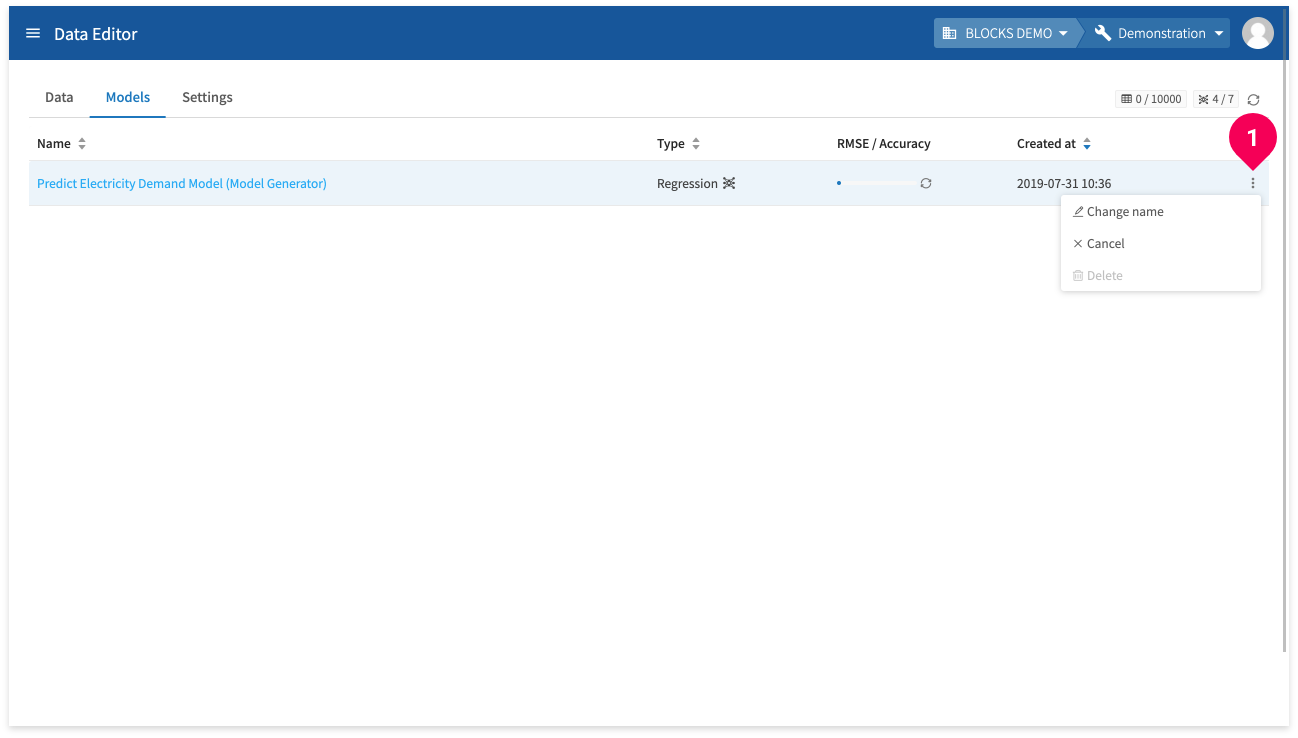
You can click a model’s menu icon (more_vert) (❶) to open a menu with the following options:
- Change name
- Stop training
- Delete
Making predictions
Once the model is created, you can use it with the testing data to make predictions by doing the following:
info_outline You can also make predictions from a Flow Designer, which also allows you to set automated schedules and run batch predictions. For more information about making predictions from a Flow Designer, refer to Using Flow templates or the classification/regression tutorial pages (classification predictions/regression predictions).
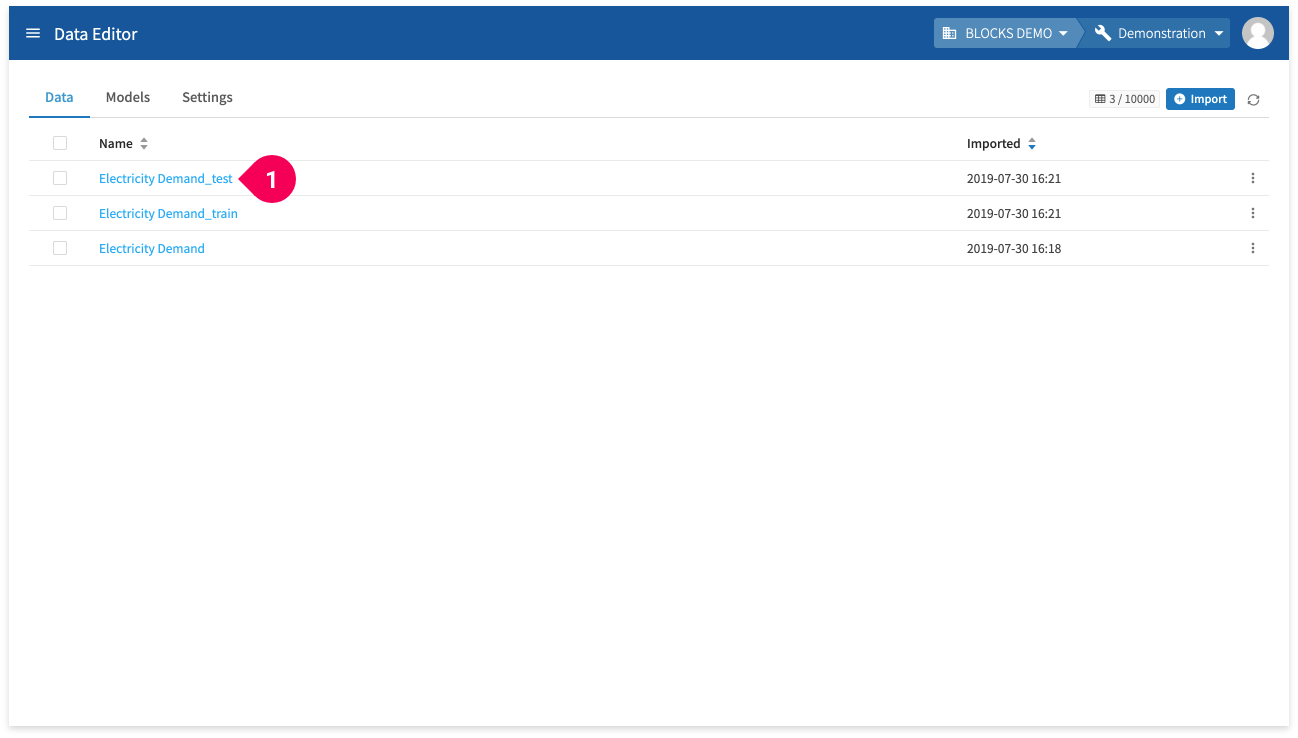
Open the testing data by doing the following:
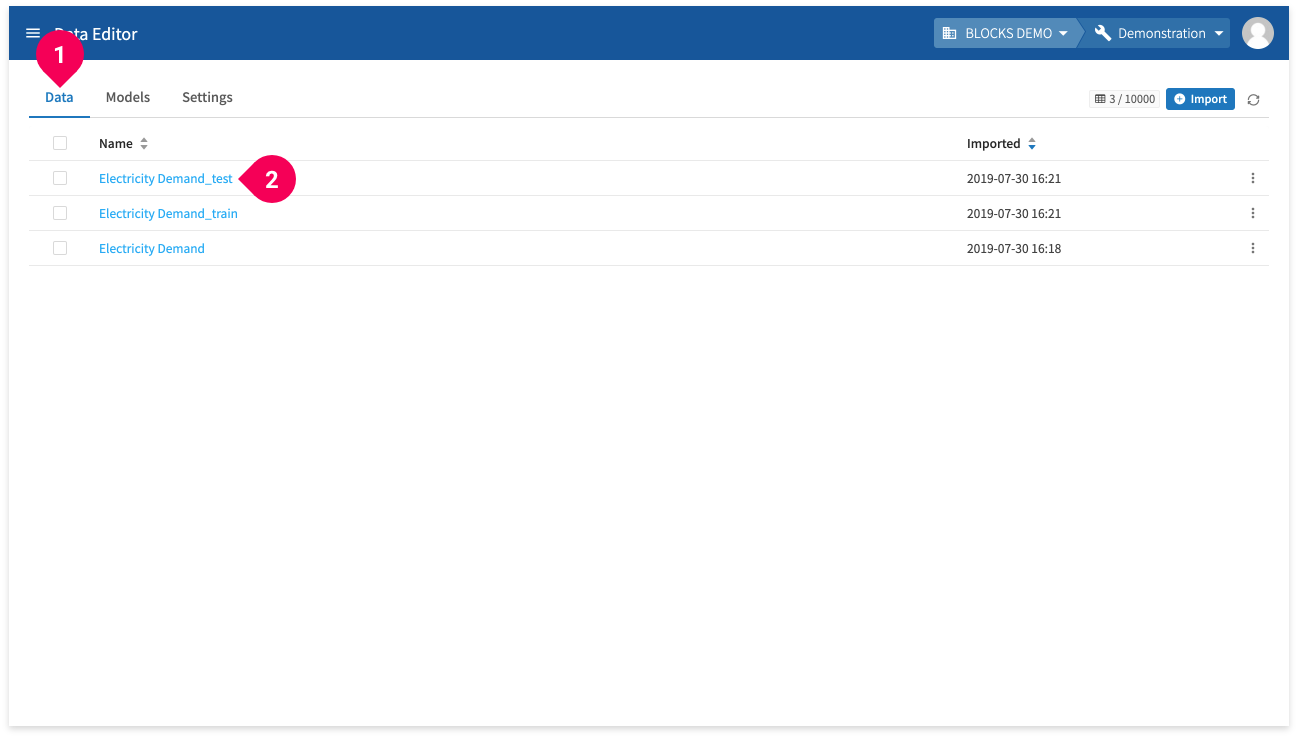
- Click Data.
- Click Electricity Demand_test.
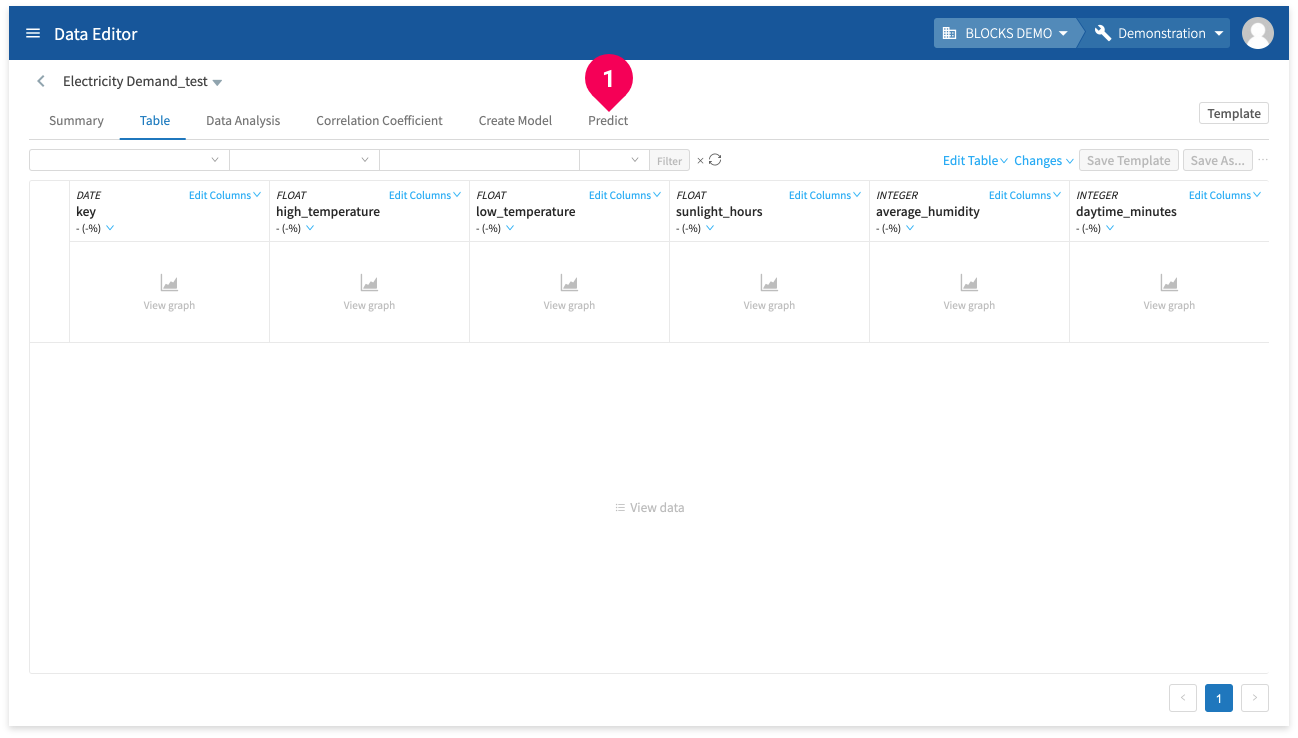
This will open the testing data in the editor.
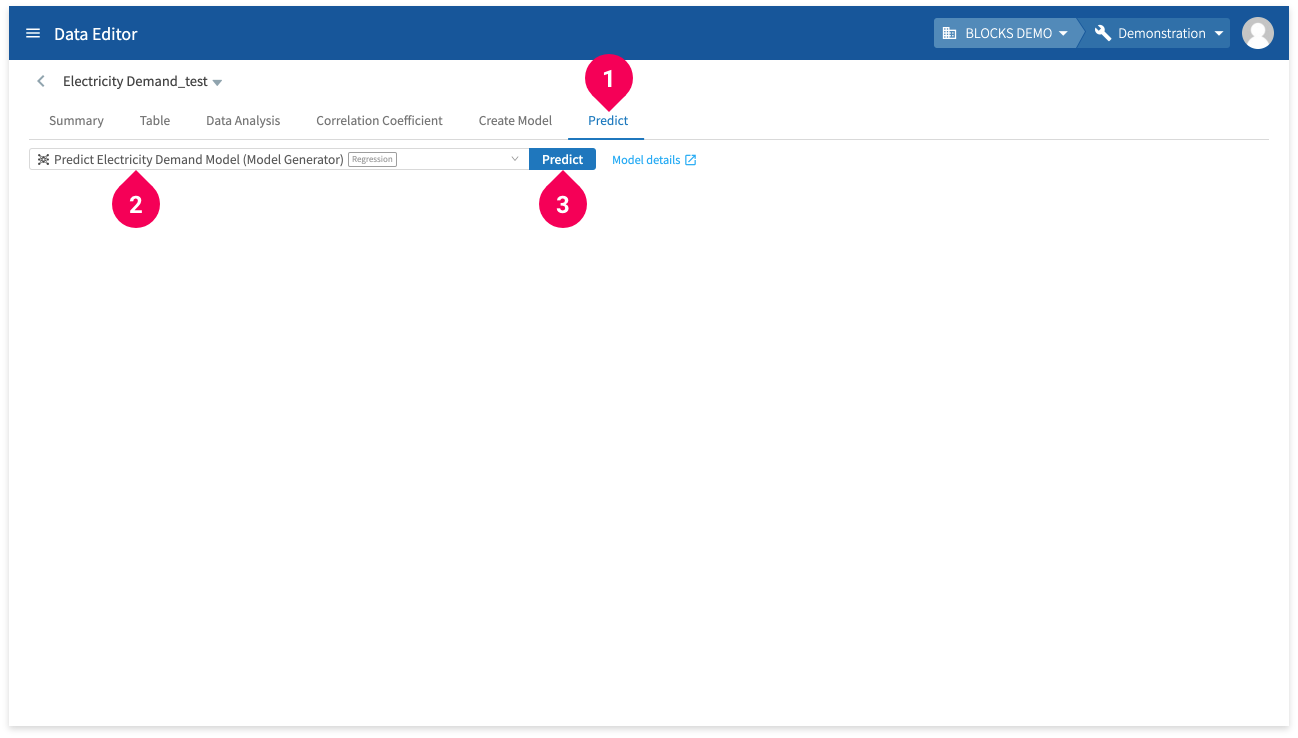
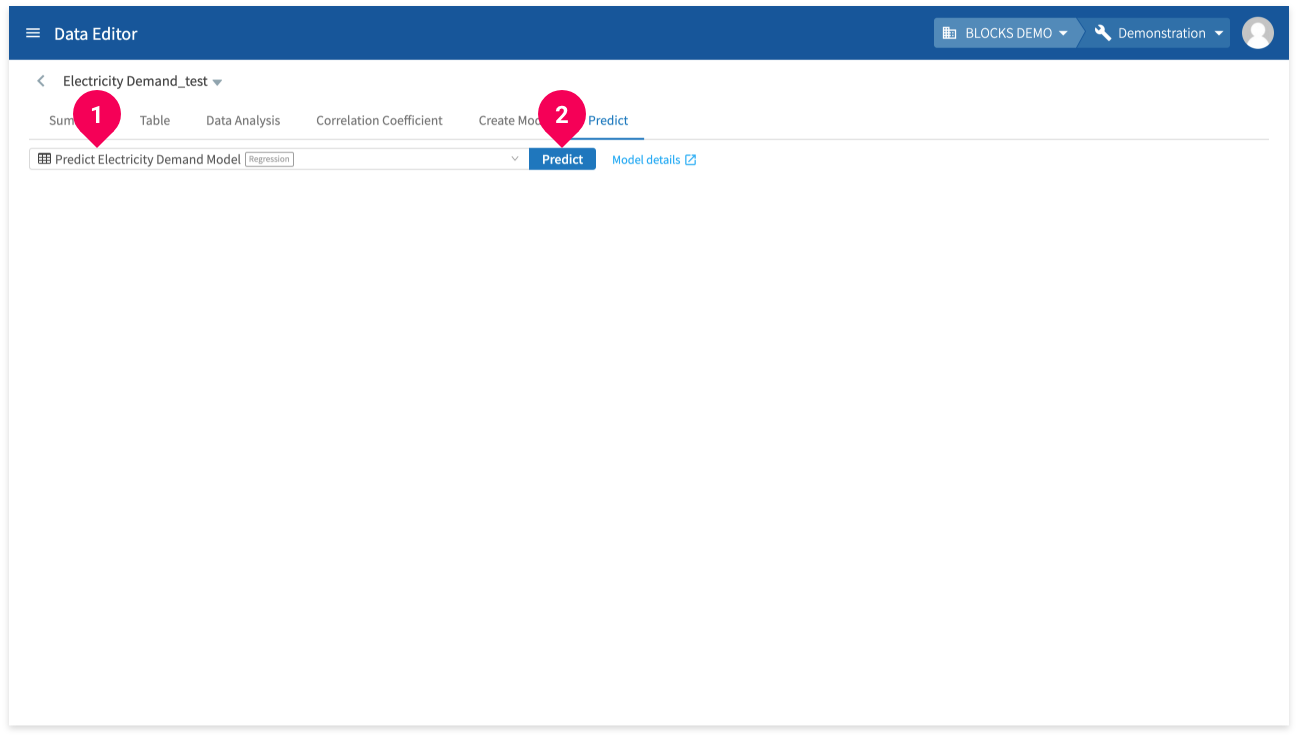
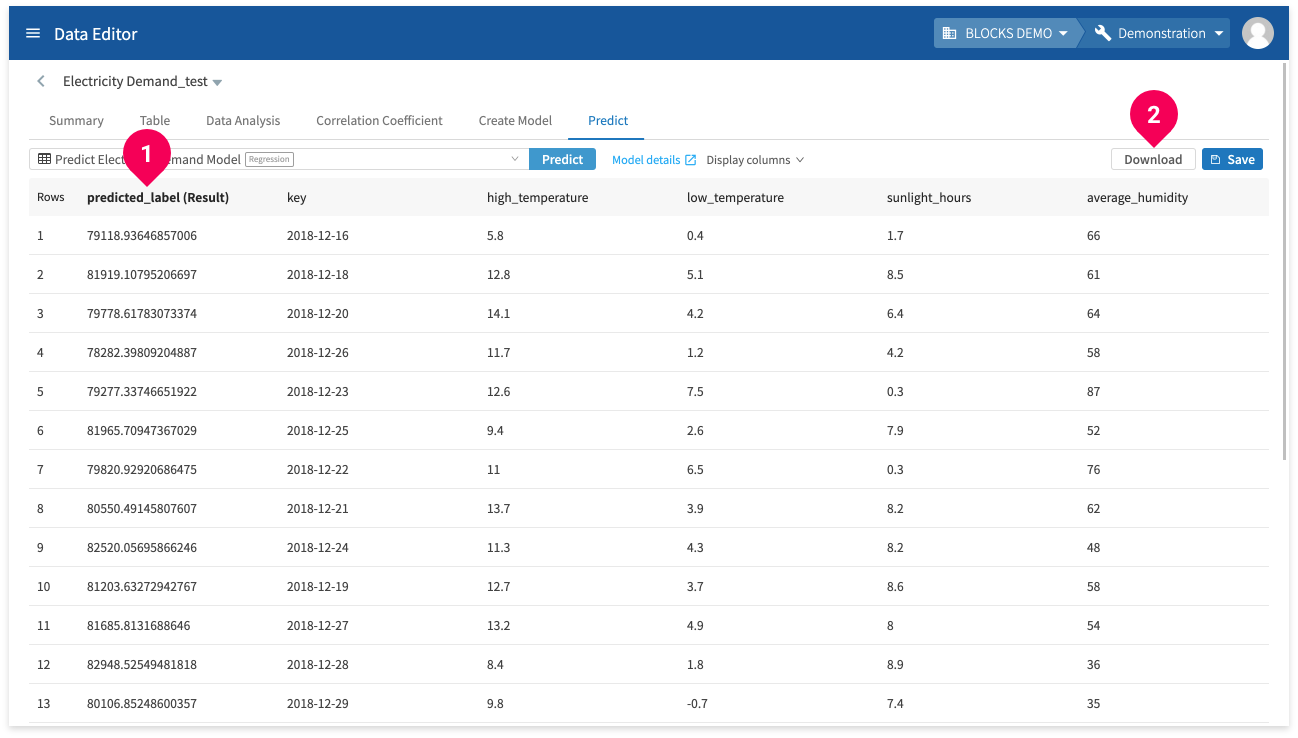
- Click Predict.
- Select Predict Electricity Demand Model (Model Generator).
- Click Predict.
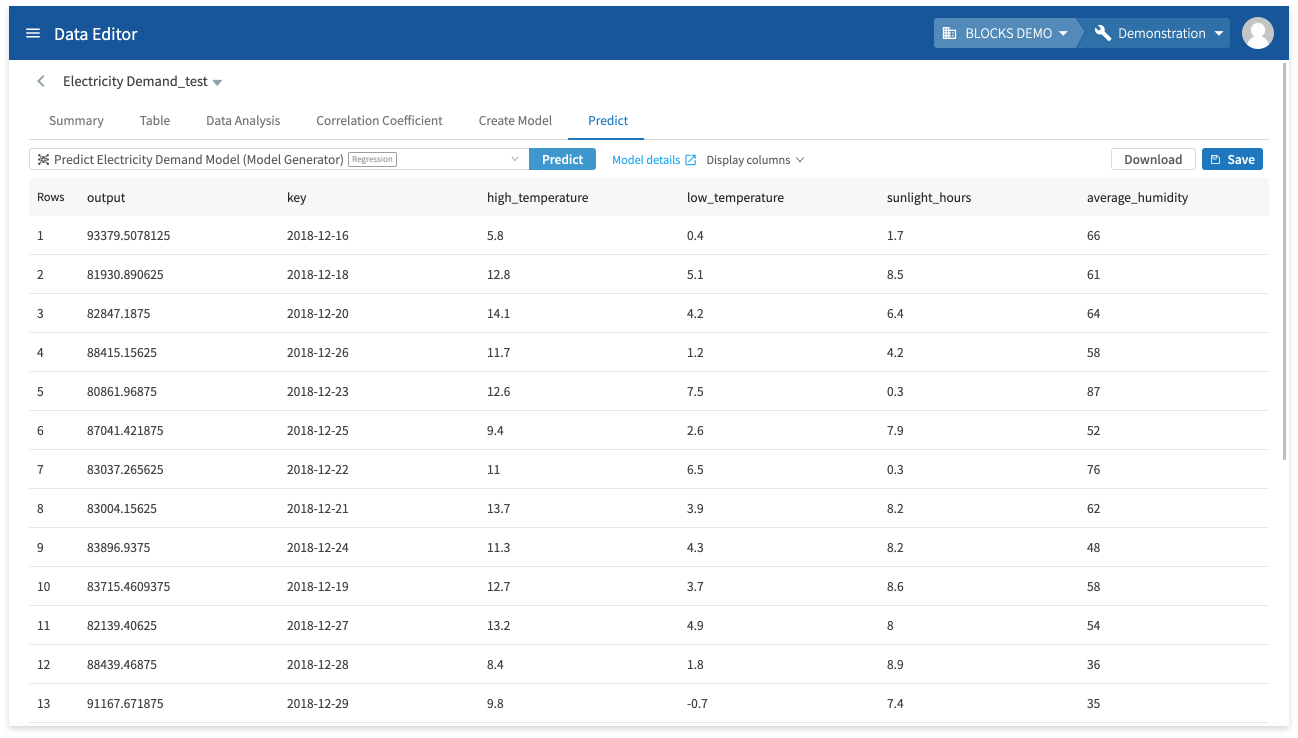
The prediction results will appear after a moment.
The following chart explains the meaning of each column in the results:
| Column | Explanation |
|---|---|
| output |
The predicted value. |
| key high_temperature low_temperature sunlight_hours average_humidity daytime_minutes |
The testing data. |
Regression example
This section will use the electricity demand data from Demand forecasting with the regression model to demonstrate how to create a regression model from the DataEditor:
Preparing the data
We’ll start by preparing the data we’ll use to train and test the model, which is the same data used in the Demand forecasting with the regression model tutorial.
If you haven’t followed followed that tutorial and need to prepare the data, complete the steps in the Preparing the data as a CSV file and Splitting the data in the DataEditor sections.
Creating the model
Once your training data is ready, create the model by doing the following:

- Click Electricity Demand_train.
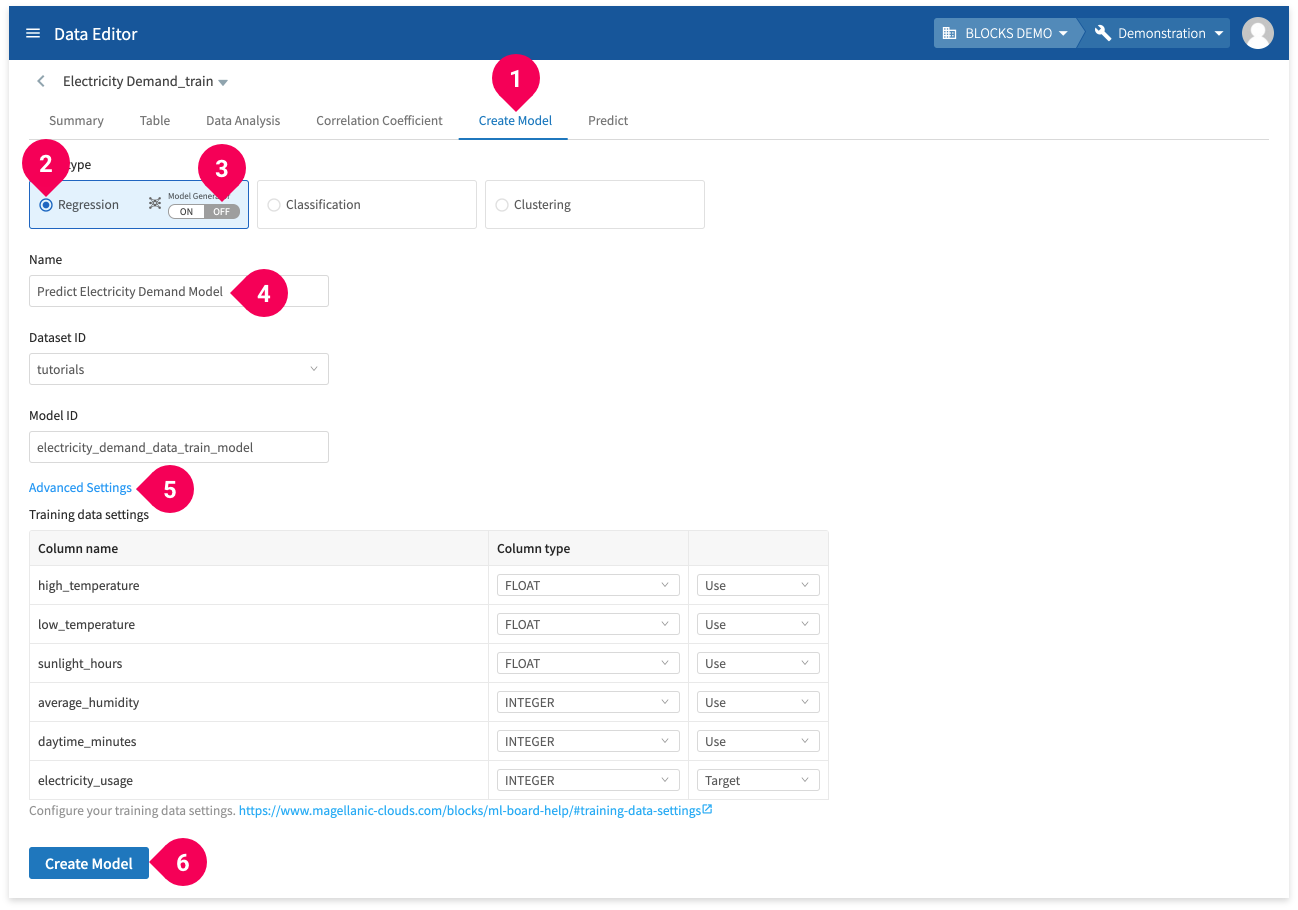
- Click Create Model.
- Click Regression.
- Set the Model Generator setting to OFF.
- Change the name to
Predict Electricity Demand Model. - Click Advanced Settings:
You can configure which columns to use from your training data. - Click Create Model.
Wait for a bit until BLOCKS finishes creating the model.
Checking the model
Once the model is created, you can check its contents by doing the following:

- Click <.

- Click Models.
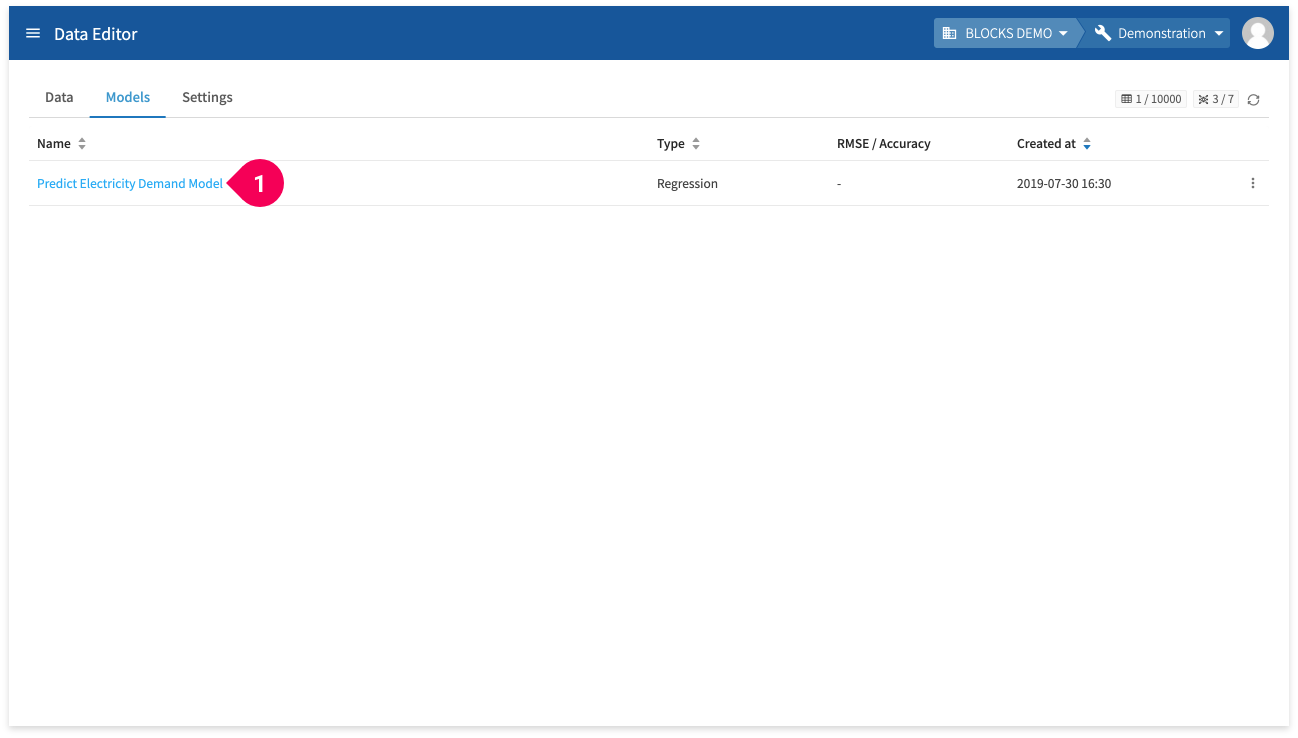
- Click Predict Electricity Demand Model.

You can check the model’s schema information (column names and types) from the model details screen.
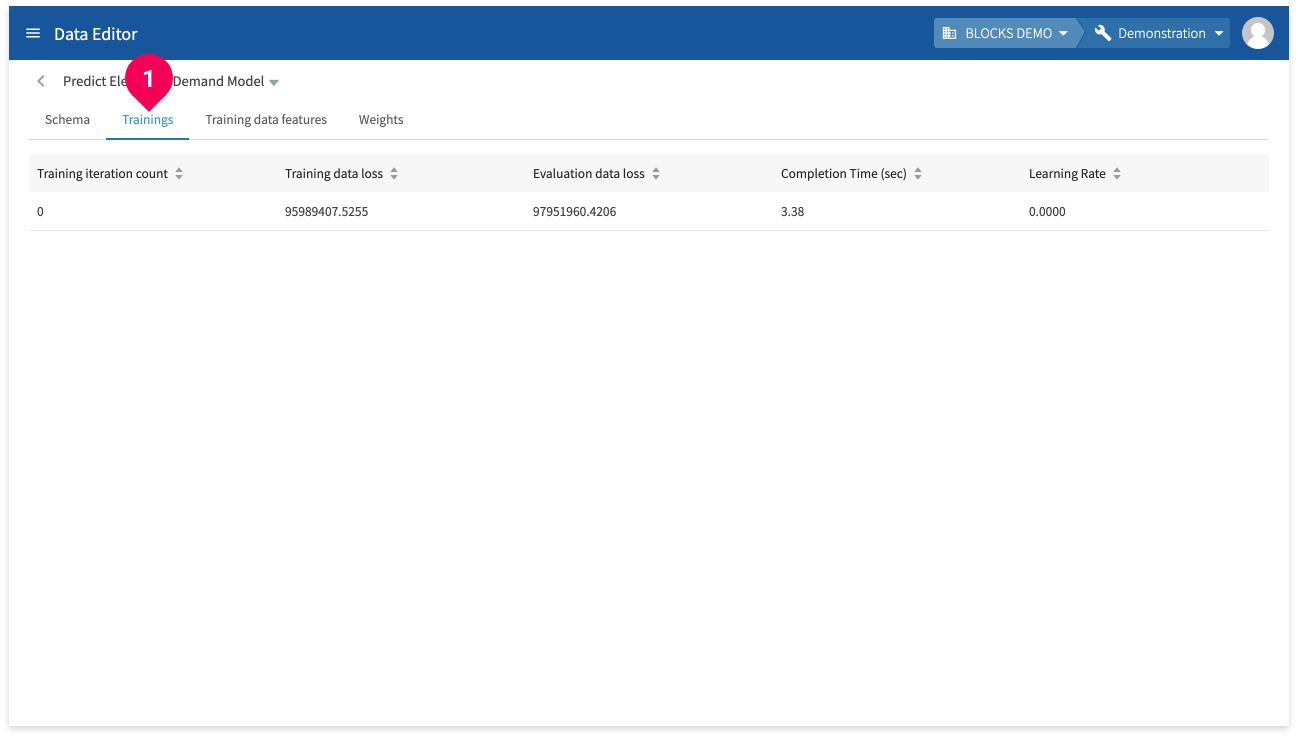
Click Trainings to view the following information about the model’s training:
- Training iteration count: The iteration number of the training.
- Training data loss: The calculated loss (Root Mean Square Error) for the training.
- Evaluation data loss: The loss for the evaluation data.
- Completion time (sec): The elapsed time for the training iteration.
- Learning rate: The learning rate for the training iteration.

Click Training data features (❶) to view information for each feature in the training data.
- Column name: Shows the name of each training data column.
- Min: Shows the minimum value for each training data column. Shows NULL if the column doesn’t contain numbers.
- Max: Shows the maximum value for each training data column. Shows NULL if the column doesn’t contain numbers.
- Mean: Shows the mean value for each training data column. Shows NULL if the column doesn’t contain numbers.
- STDDEV: Shows the standard deviation for each training data column. Shows NULL if the column doesn’t contain numbers.
- Category count: Shows the number of categories. Shows NULL if the column doesn’t contain categorical data.
- NULL count: Shows the number of NULL entries.
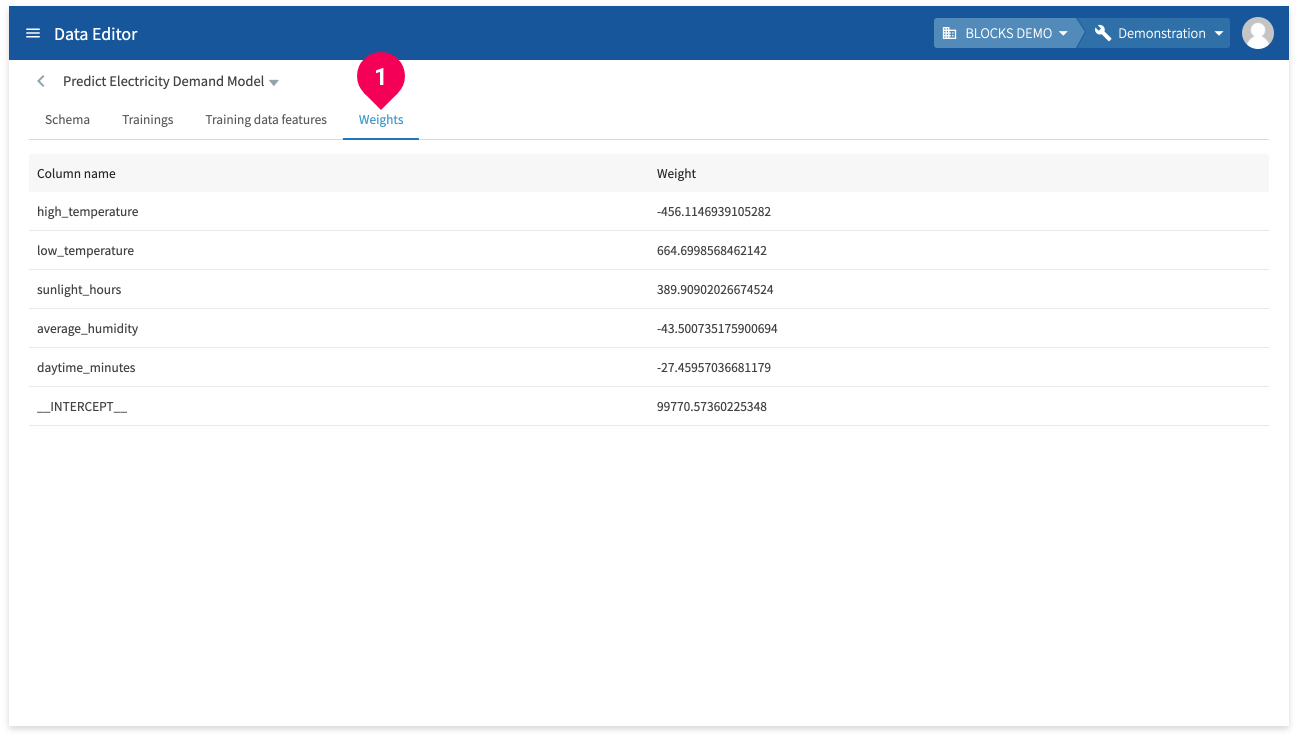
Click Weights to view the weight of each column.
If the model’s results are not good enough, you can reevaluate your training data features and create a new models until you create one that meets your needs.
Making predictions
If there are no problems with the contents of your model, you can use it to make predictions by doing the following:
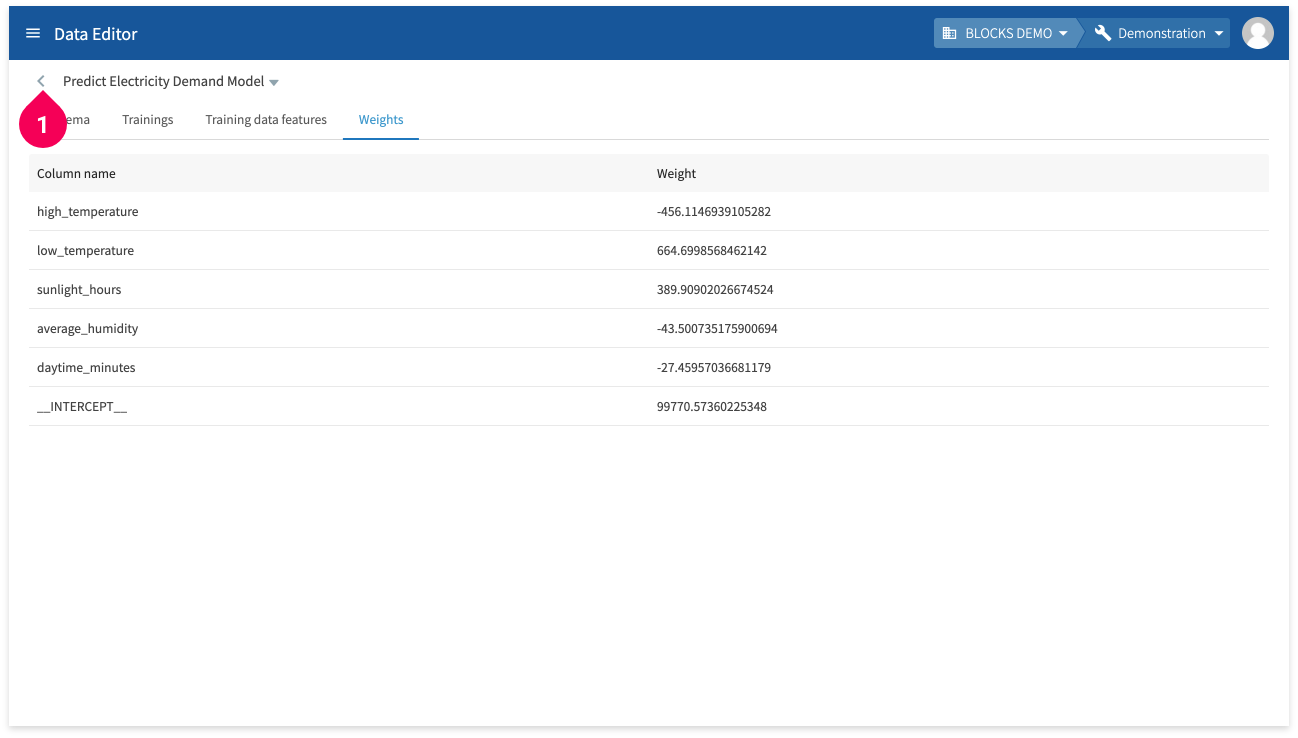
- Click <.
- Click Data.
- Click Electricity Demand_test.
- Click Predict.
- Click Predict Electricity Demand Model.
- Click Predict.
The results will appear after a bit of time.
You can click Download to download a CSV file of the results.
- If there are multiple pages of results, clicking download will only download the results from the pages you have loaded in the DataEditor.
For example, if there were three pages of results and you clicked to view page two, and then you clicked Download, the download would include the results from pages one and two.
Classification (Model Generator version) example
This section will use the iris data from Categorize data with the classification model to demonstrate how to use a classification (Model Generator version) model.
Preparing the data
We’ll start by preparing the data we’ll use to train and test the model, which is the same data used in the Categorize data with the classification model tutorial.
If you haven’t followed followed that tutorial and need to prepare the data, complete the steps in the Preparing the data as a CSV file and Splitting the data in the DataEditor sections.
Creating the model
Once your training data is ready, create the model by doing the following:

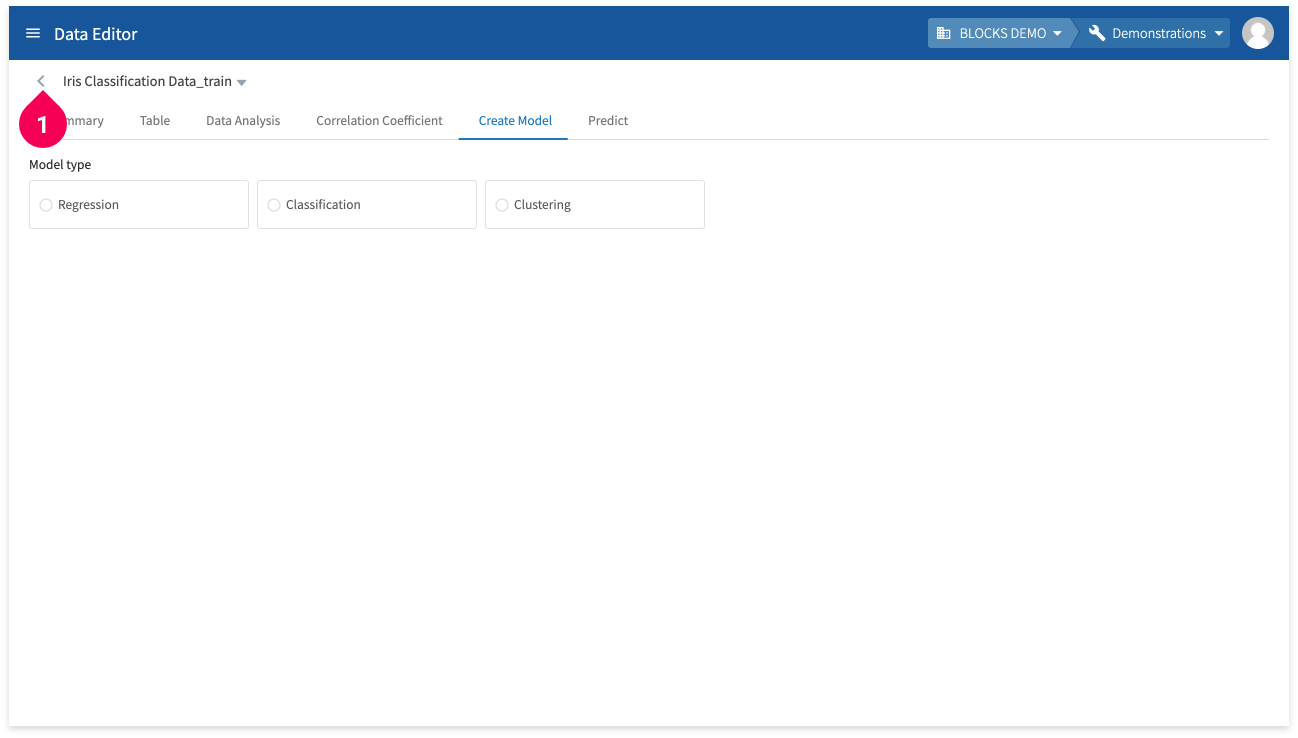
- Click Iris Classification Data_train.
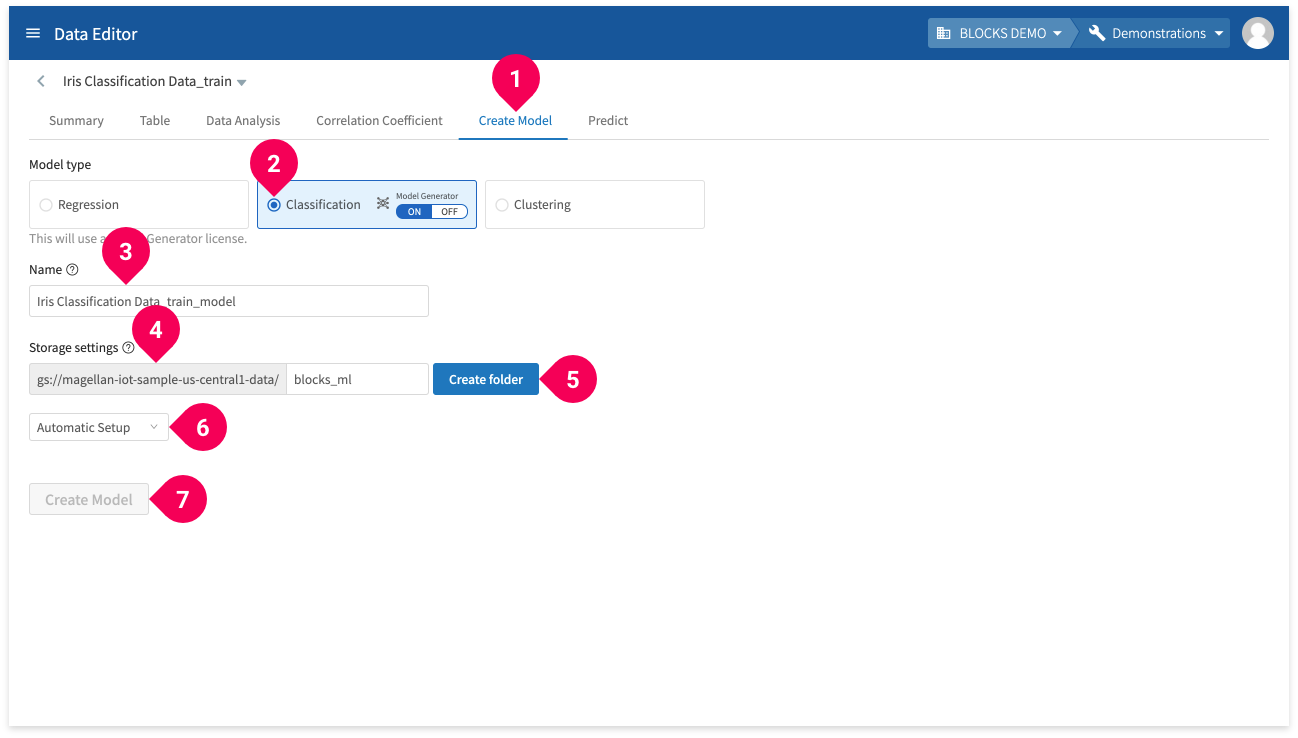
- Click Create Model.
- Click Classification.
- Enter a name for the model.
- Designate the Google Cloud Storage (GCS) folder that will store your models (only if it’s the first time you are creating a Model Generator).
- Click Create Folder (only if it’s the first time you are creating a Model Generator).
- Select Automatic Setup or Manual Setup:
- Automatic Setup: Automatically sets the maximum time until timeout to 30 minutes and the maximum number of trials to 20.
- Manual Setup: Allows you to configure the the maximum time until timeout, maximum number of trials, and training data settings before creating the model.
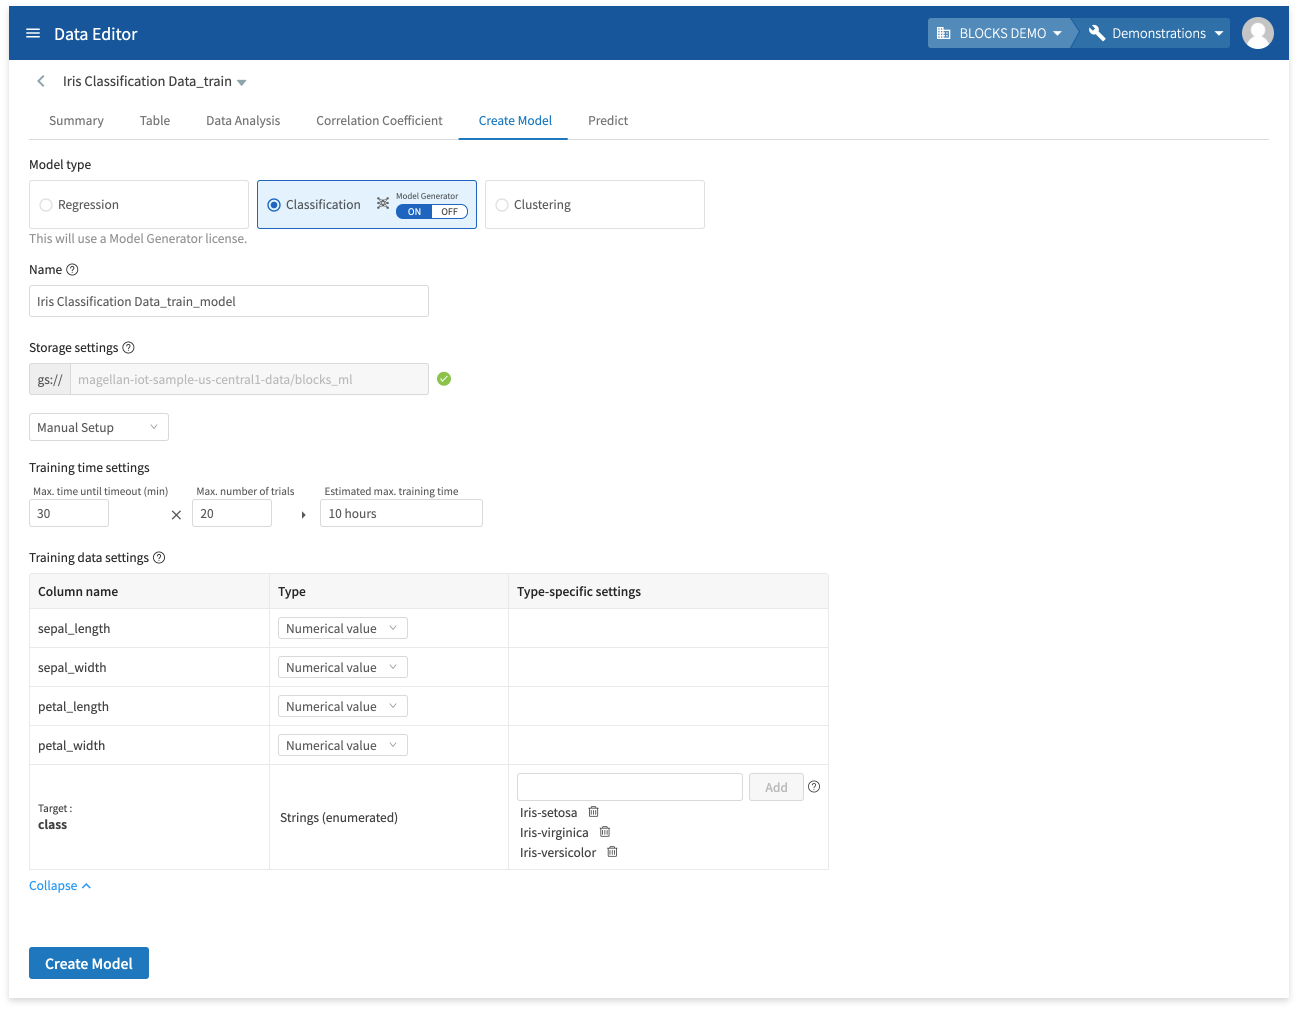
info_outline The training may stop itself before the maximum time before timeout if its results worsen drastically. The actual training time may differ from the estimated maximum training time.
- Click Create Model.
You can check on the progress of the model’s training by doing the following:
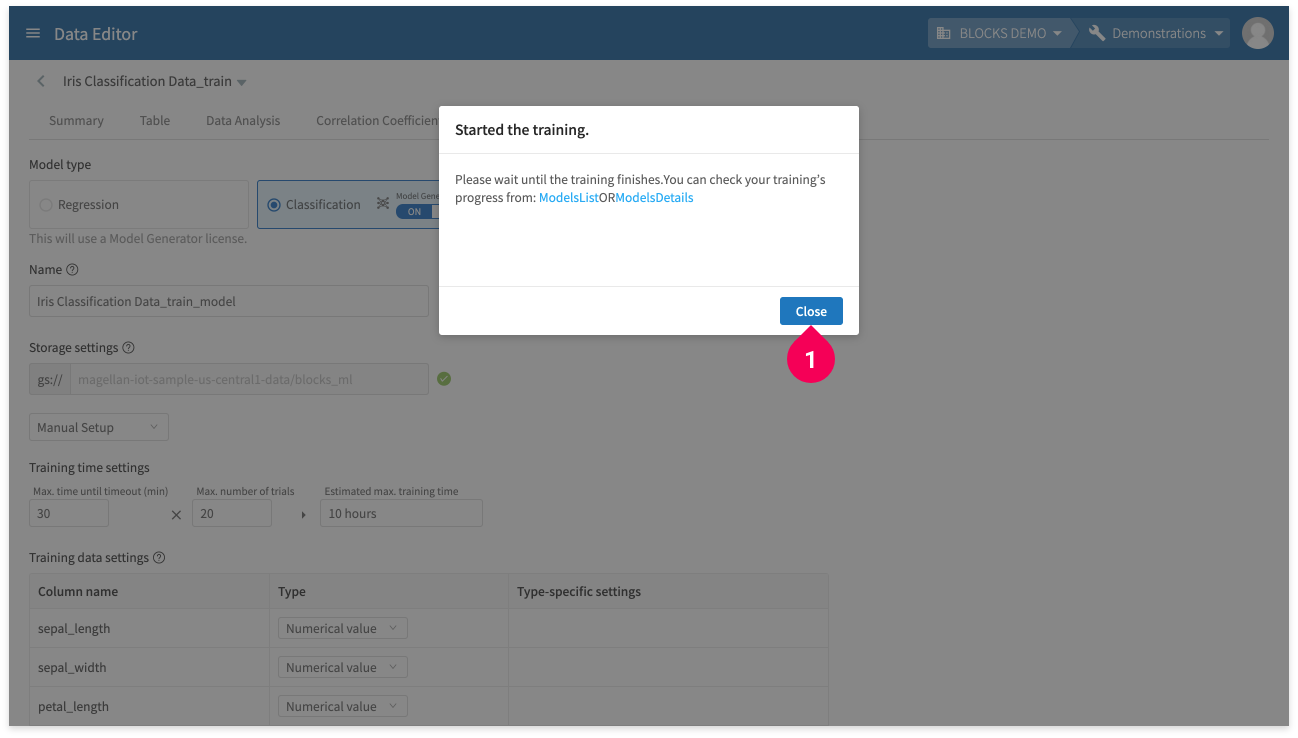
- Click Close.
- Click <.
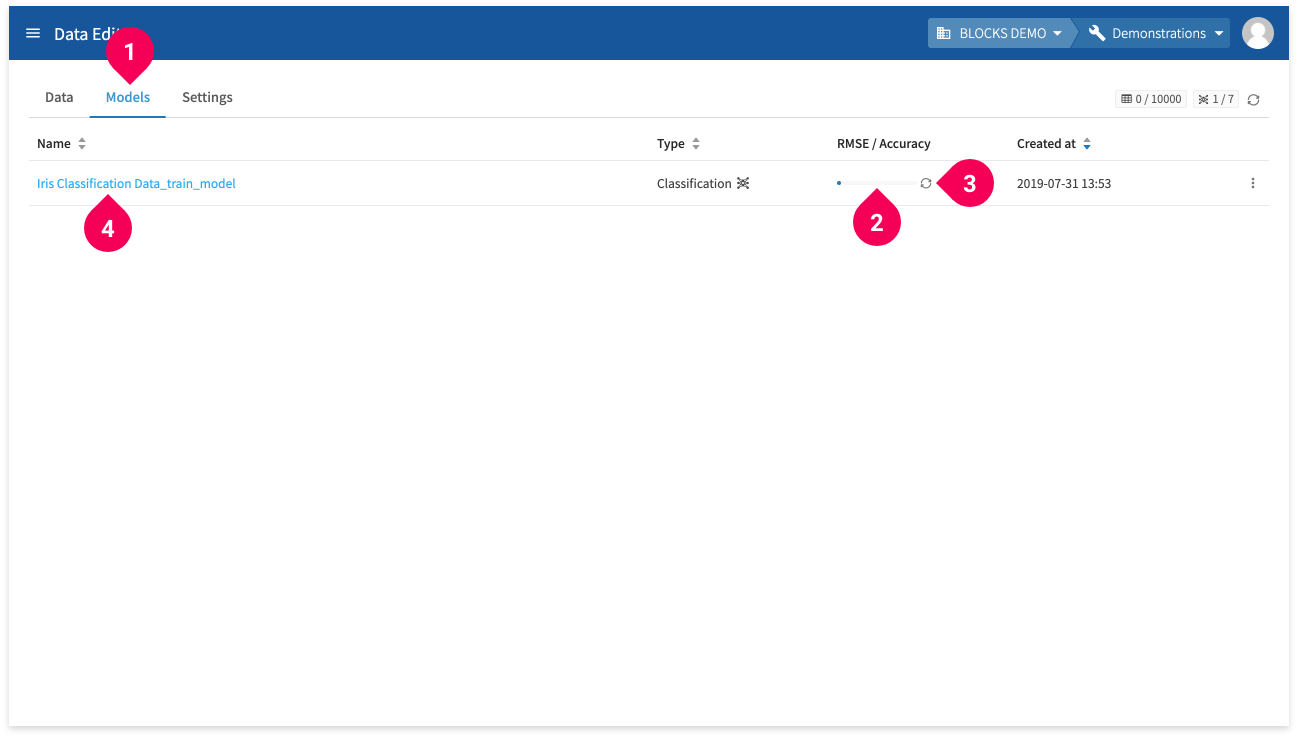
- Click Models.
- View the progress bar to see the training’s progress.
- Click the refresh icon to refresh the progress bar.
- Click the name to view the model’s details page.
The following is an example of a model’s details:
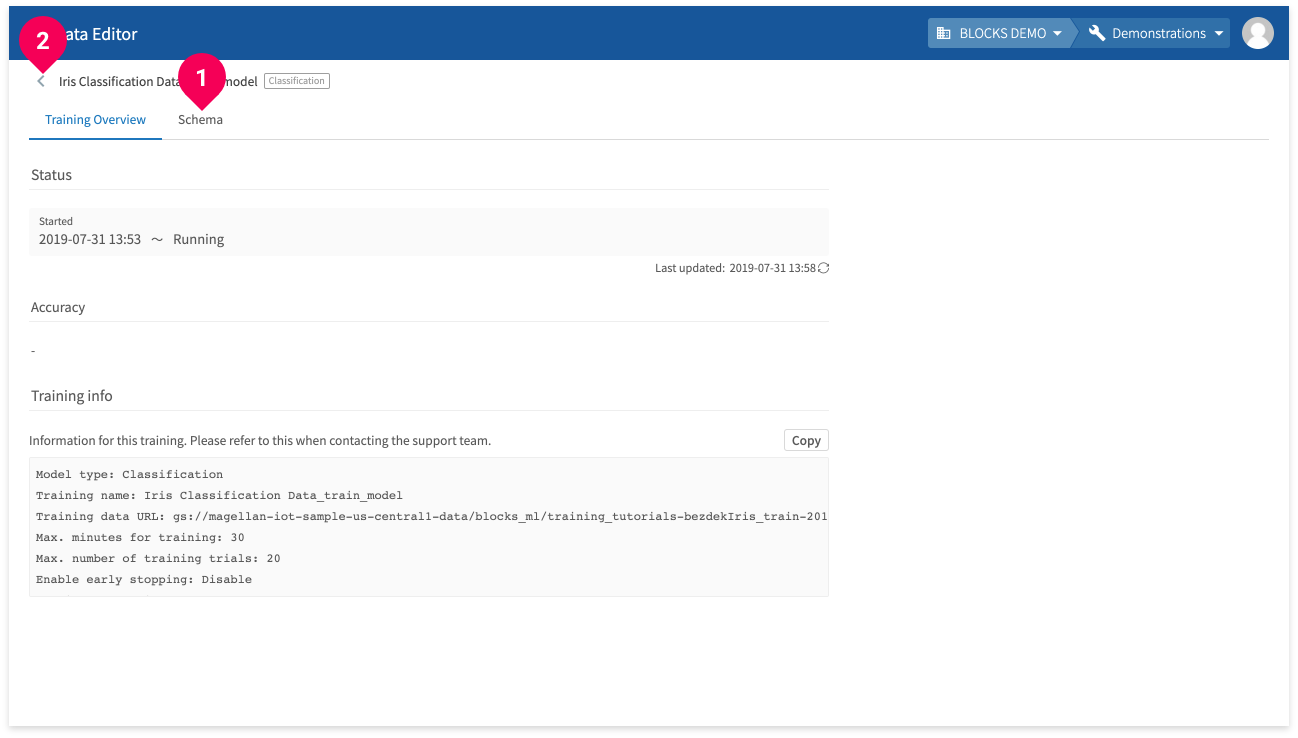
- You can click Schema to view the model’s schema information.
- Click < to return to the model list.
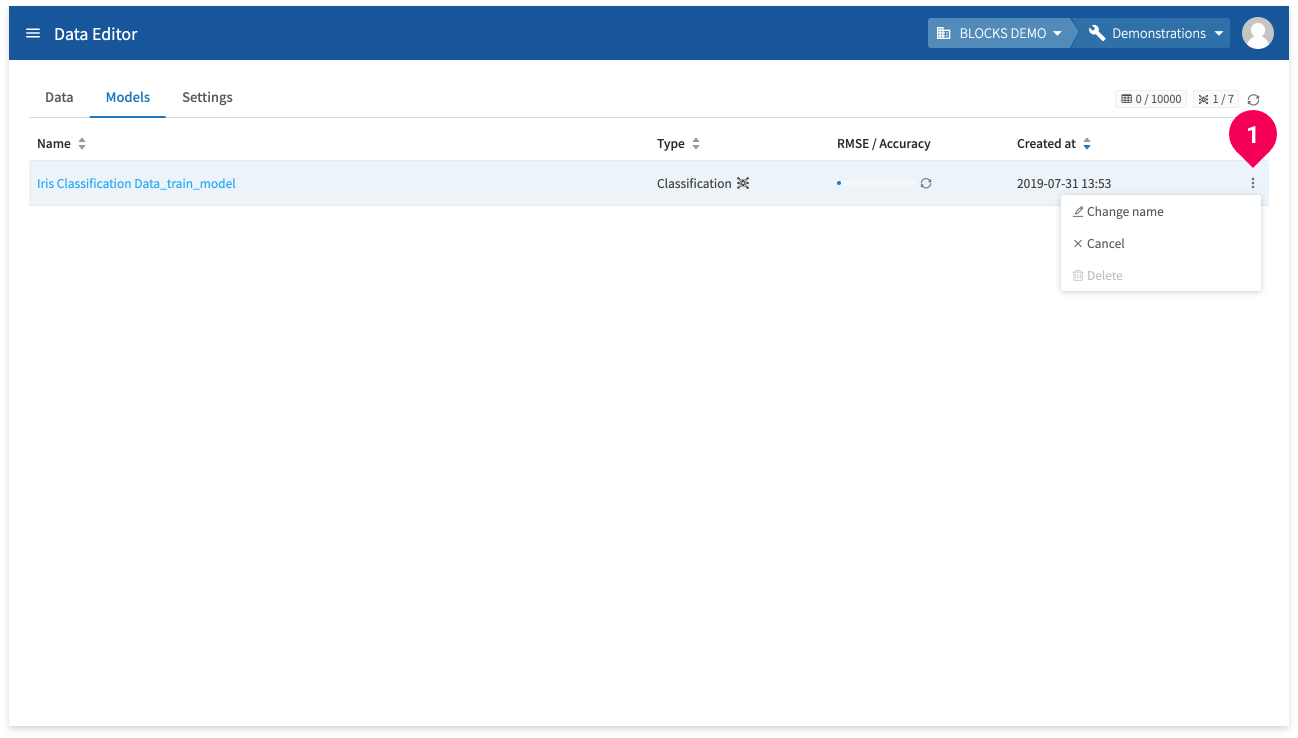
You can click a model’s menu icon (more_vert) (❶) to open a menu with the following options:
- Change name
- Stop training
- Delete
Making predictions
Once the model is created, you can use it with the testing data to make predictions by doing the following:
info_outline You can also make predictions from a Flow Designer, which also allows you to set automated schedules and run batch predictions. For more information about making predictions from a Flow Designer, refer to Using Flow templates or the classification/regression tutorial pages (classification predictions/regression predictions).
Open the testing data by doing the following:
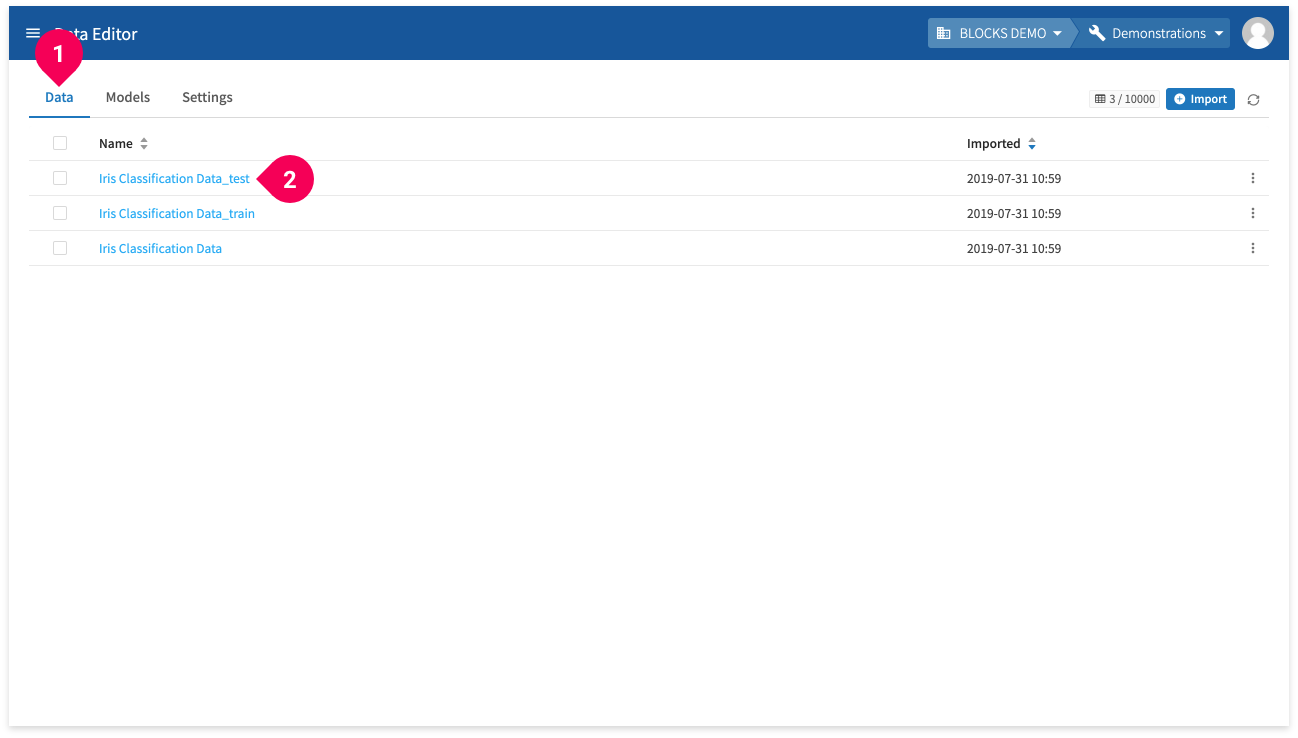
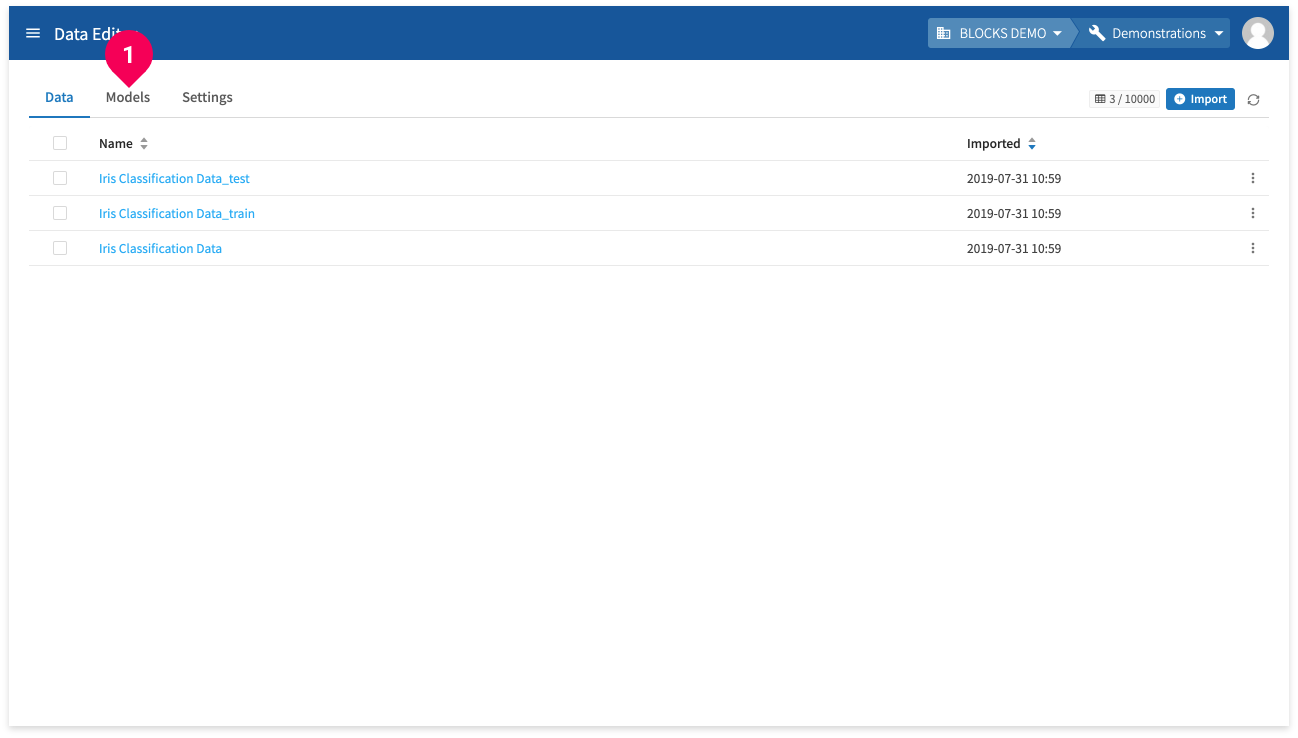
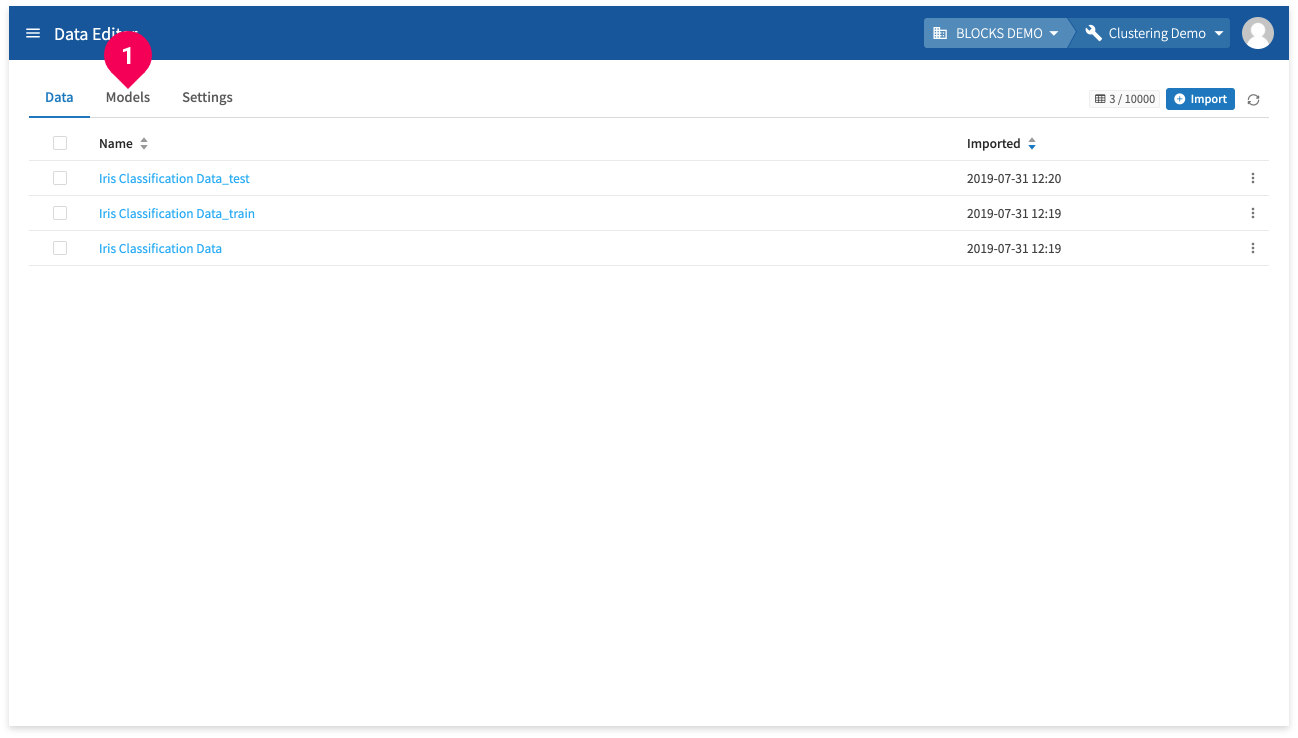
- Click Data.
- Click Iris Classification Data_test.
This will open the testing data in the editor.
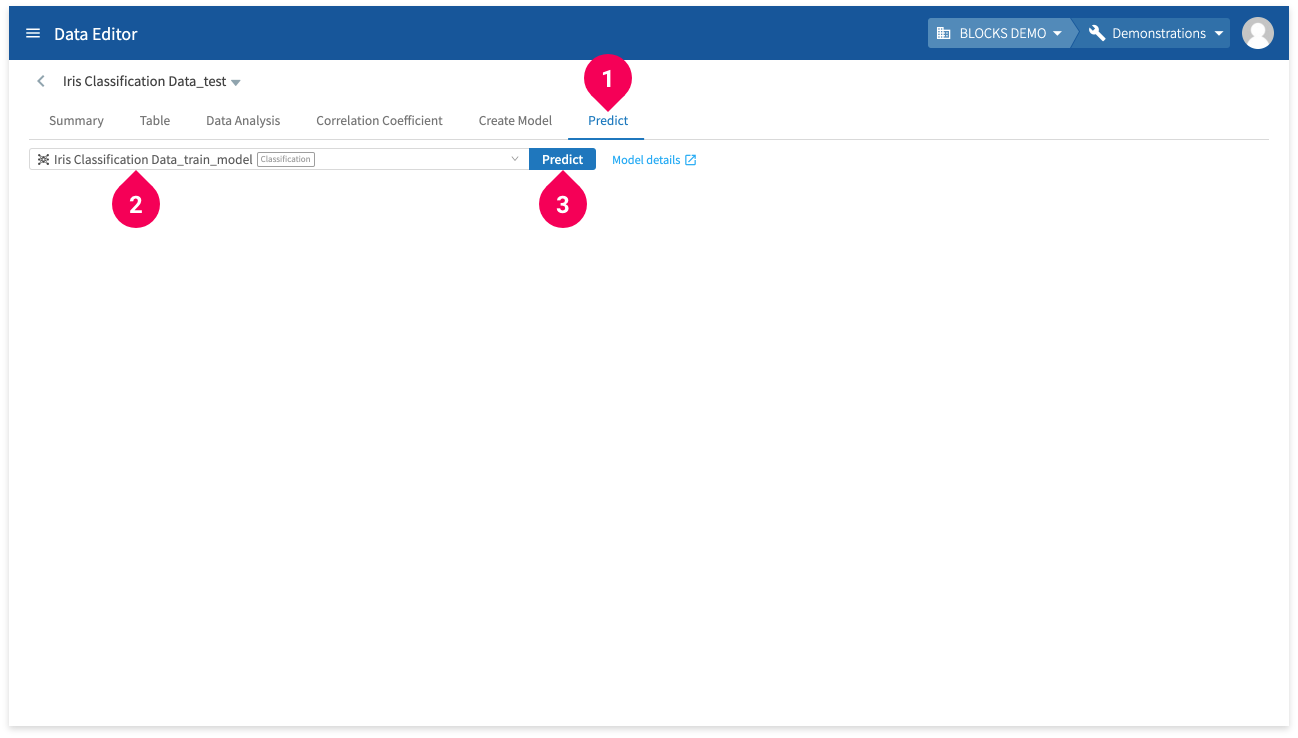
- Click Predict.
- Click Iris Classification Data_train_model.
- Click Predict.
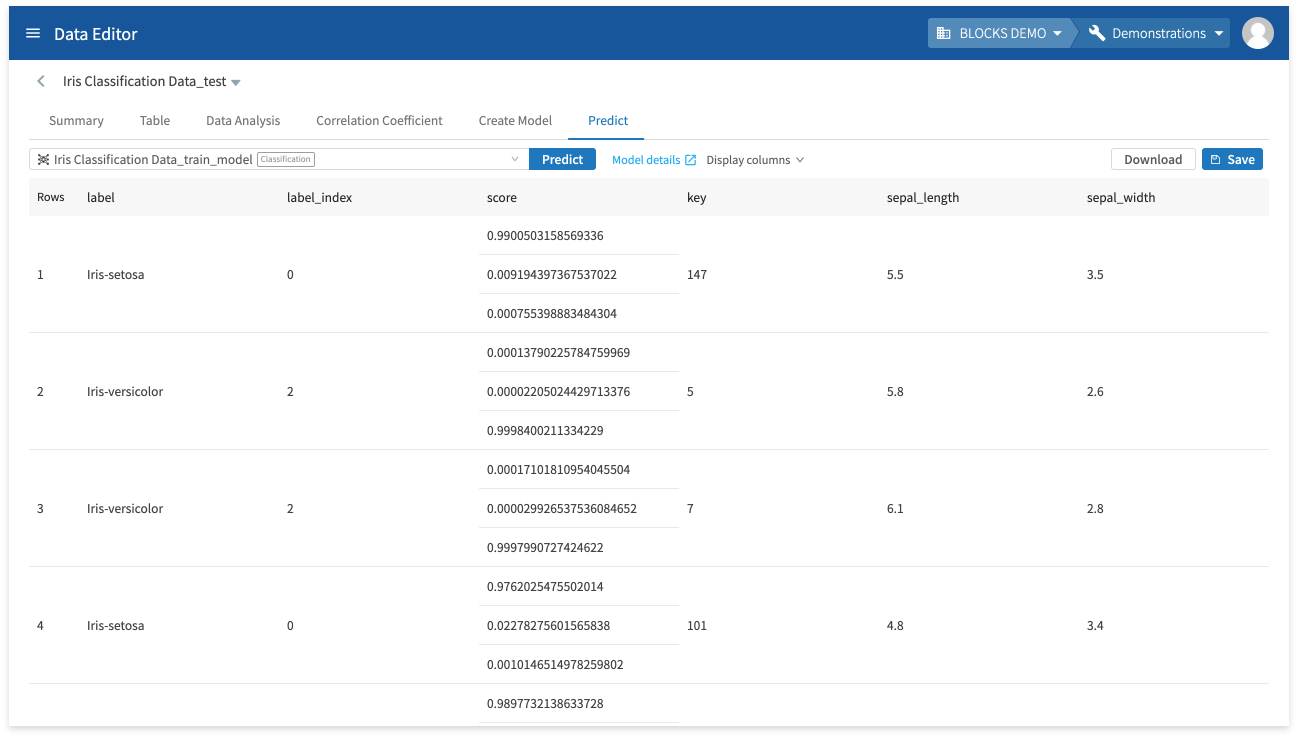
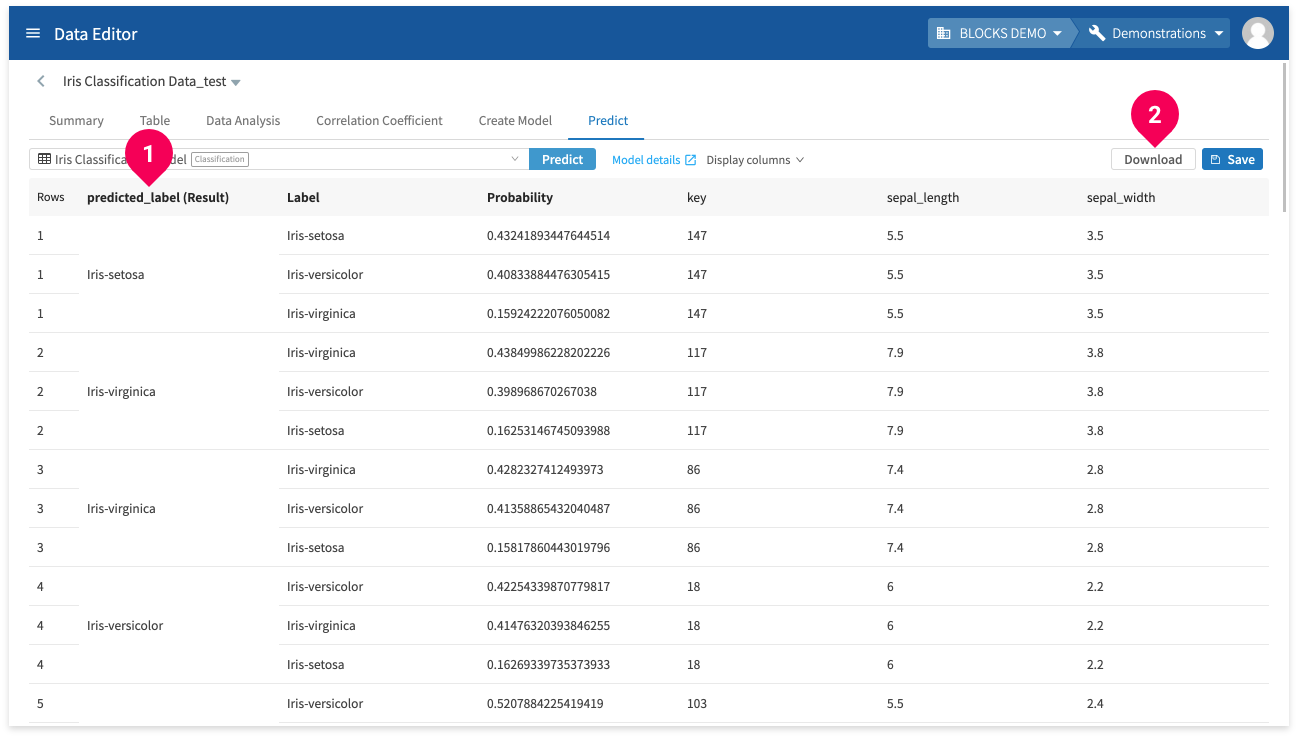
The prediction results will appear after a moment.
The following chart explains the meaning of each column in the results:
| Column | Explanation |
|---|---|
| label |
The predicted label. For this example, the possible labels are Iris-virginica, Iris-setosa, or Iris-versicolor. |
| label_index |
The index number for the list of values in the score column that corresponds with the value in the label column. A 0 corresponds with the first value in the score column, a 1 with the second, and so on. For the example, the values in the score column are ordered as Iris-virginica, Iris-setosa, and Iris-versicolor. As such, 0 refers to Iris-virginica, 1 refers to Iris-setosa, and 2 refers to Iris-versicolor. |
| score |
The confidence level for predicting each label. For this example, the values are ordered as Iris-virginica, Iris-setosa, and Iris-versicolor. |
| key sepal_length sepal_width petal_length petal_width |
The testing data. |
Classification example
This section will use the iris data from Categorize data with the classification model to demonstrate how to use a classification model.
Preparing the data
We’ll start by preparing the data we’ll use to train and test the model, which is the same data used in the Categorize data with the classification model tutorial.
If you haven’t followed followed that tutorial and need to prepare the data, complete the steps in the Preparing the data as a CSV file and Splitting the data in the DataEditor sections.
Creating the model
Once your training data is ready, create the model by doing the following:

- Click Iris Classification Data_train.
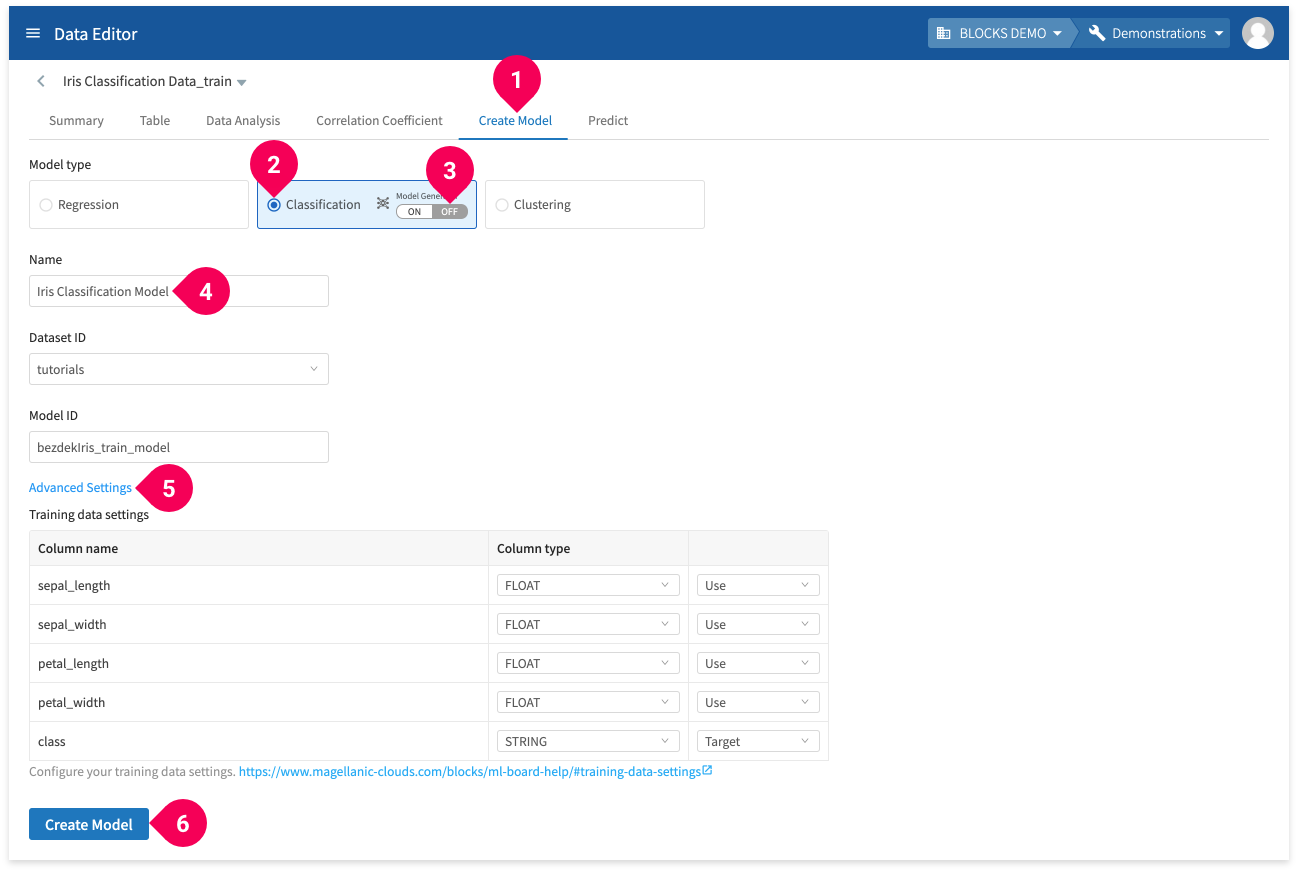
- Click Create Model.
- Click Classification.
- Set the Model Generator setting to OFF.
- Change the name to
Iris Classification Model. - Click Advanced Settings:
You can configure which columns to use from your training data. - Click Create Model.
Wait for a bit until BLOCKS finishes creating the model.
Checking the model
Once the model is created, you can check its contents by doing the following:

- Click <.
- Click Models.
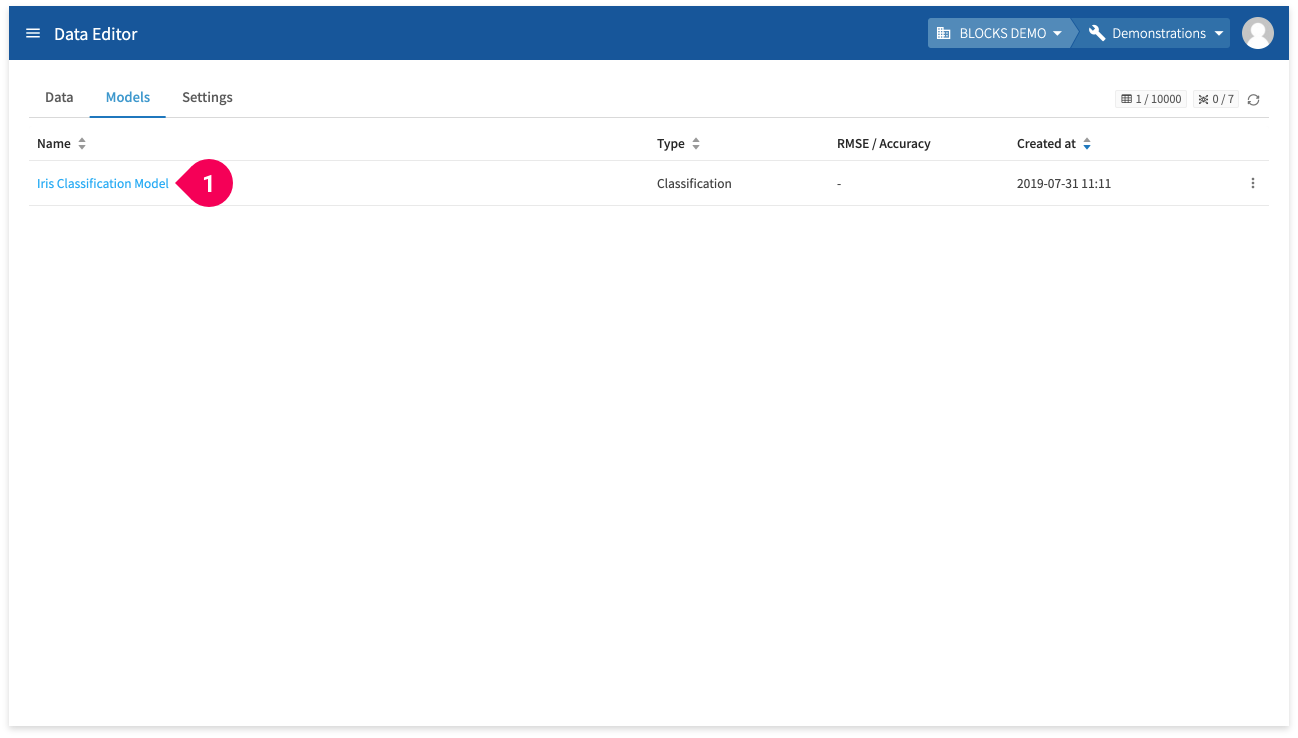
- Click Iris Classification Model.
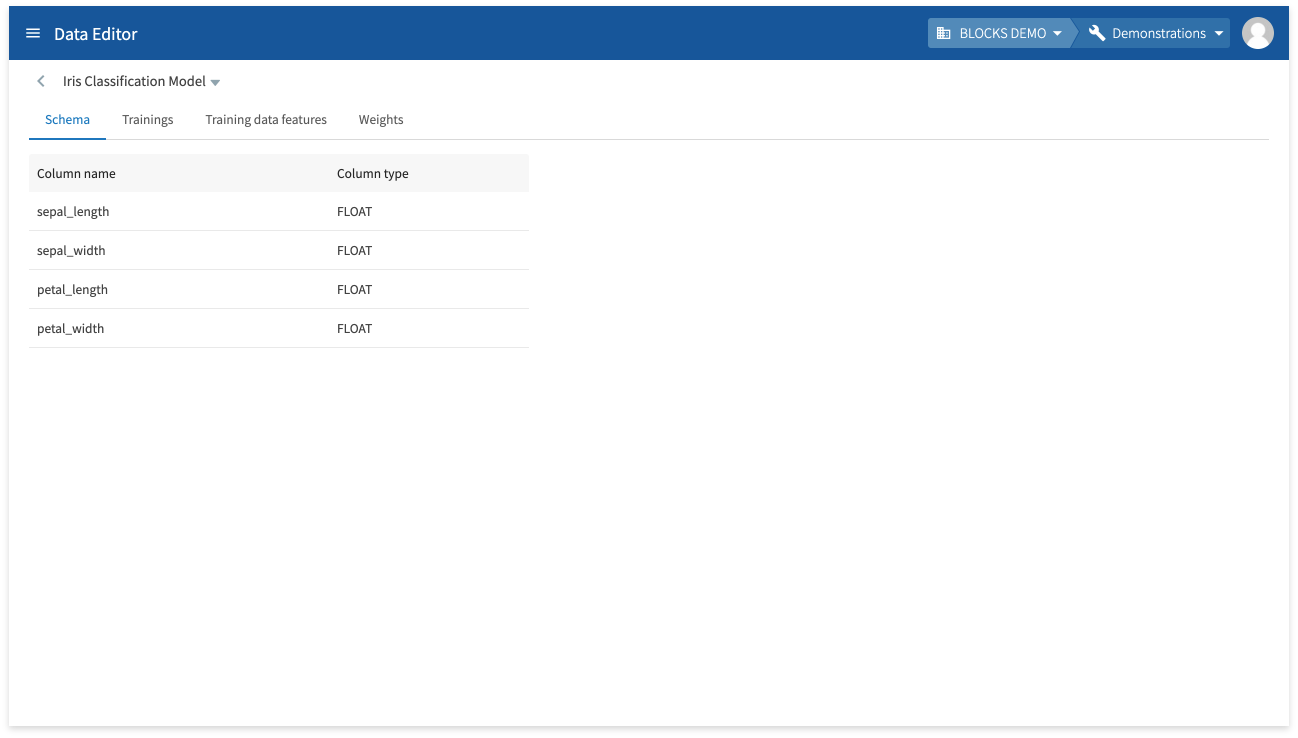
You can check the model’s schema information (column names and types) from the model details screen.
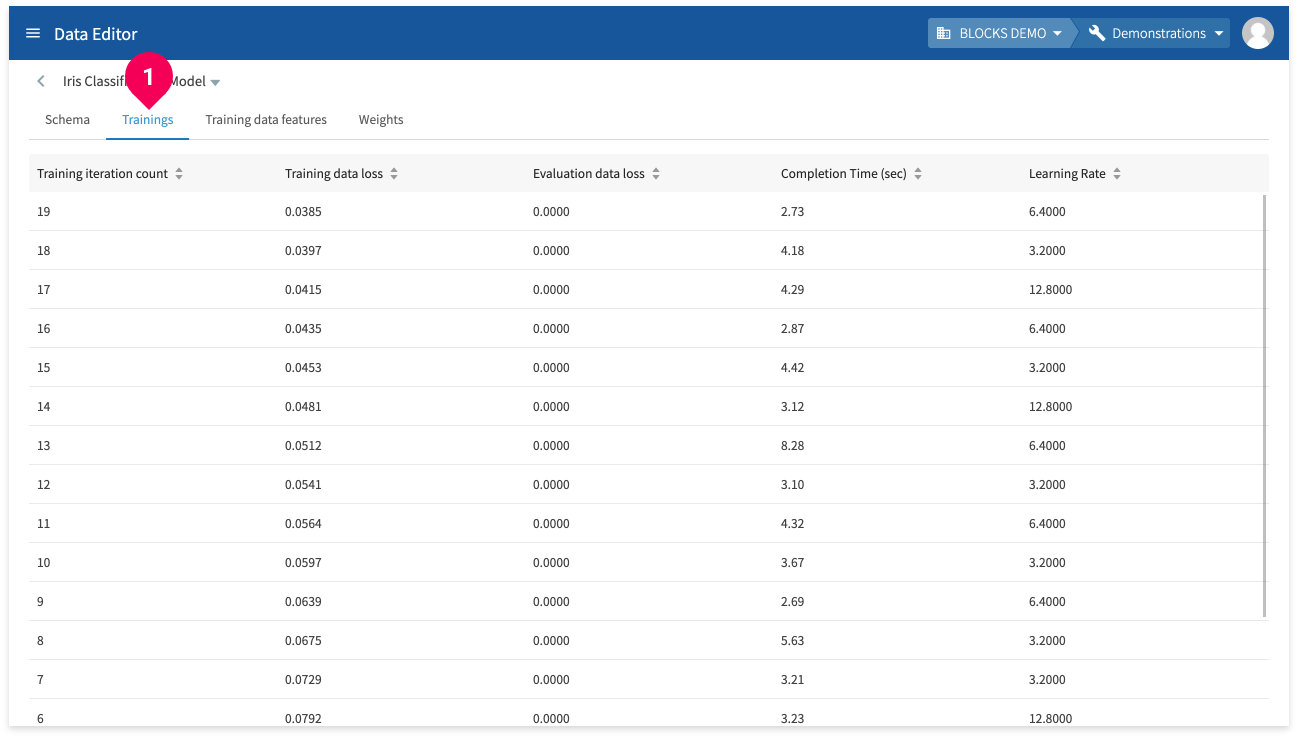
Click Trainings to view the following information about the model’s training:
- Training iteration count: The iteration number of the training.
- Training data loss: The calculated loss (Root Mean Square Error) for the training.
- Evaluation data loss: The loss for the evaluation data.
- Completion time (sec): The elapsed time for the training iteration.
- Learning rate: The learning rate for the training iteration.
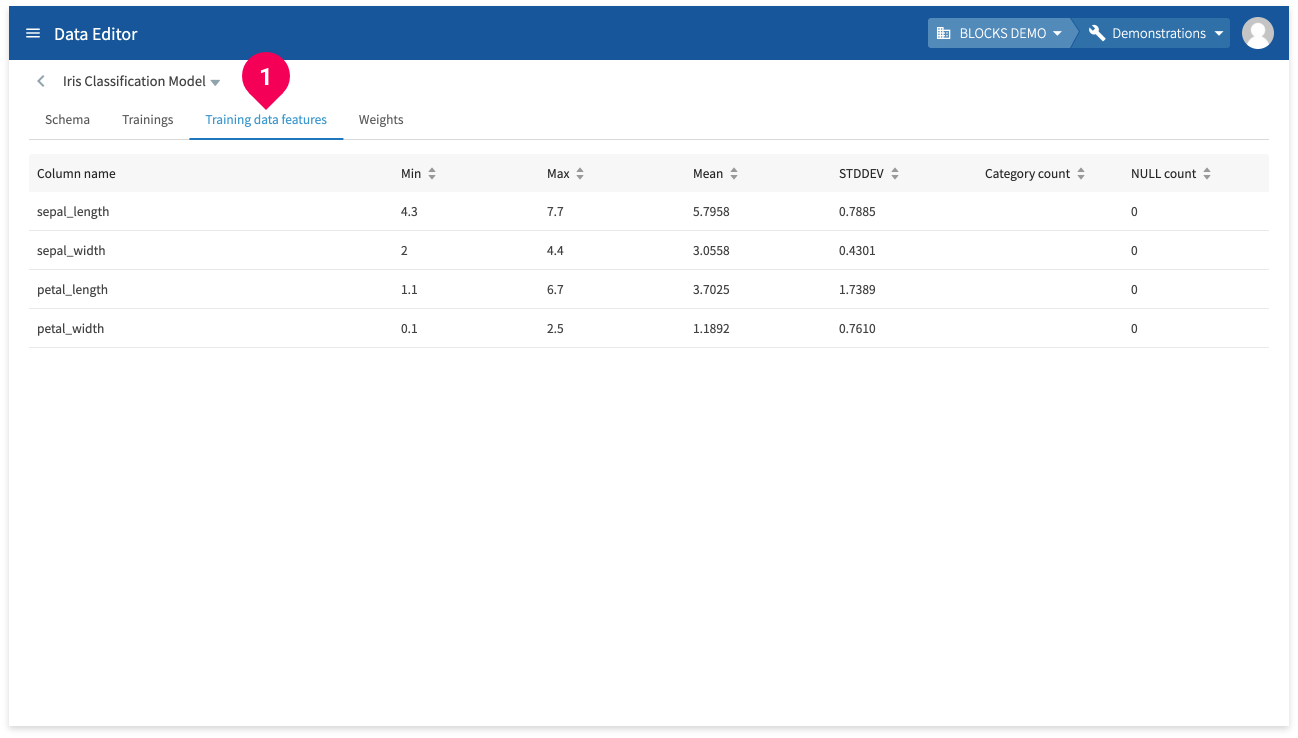
Click Training data features (❶) to view information for each feature in the training data.
- Column name: Shows the name of each training data column.
- Min: Shows the minimum value for each training data column. Shows NULL if the column doesn’t contain numbers.
- Max: Shows the maximum value for each training data column. Shows NULL if the column doesn’t contain numbers.
- Mean: Shows the mean value for each training data column. Shows NULL if the column doesn’t contain numbers.
- STDDEV: Shows the standard deviation for each training data column. Shows NULL if the column doesn’t contain numbers.
- Category count: Shows the number of categories. Shows NULL if the column doesn’t contain categorical data.
- NULL count: Shows the number of NULL entries.
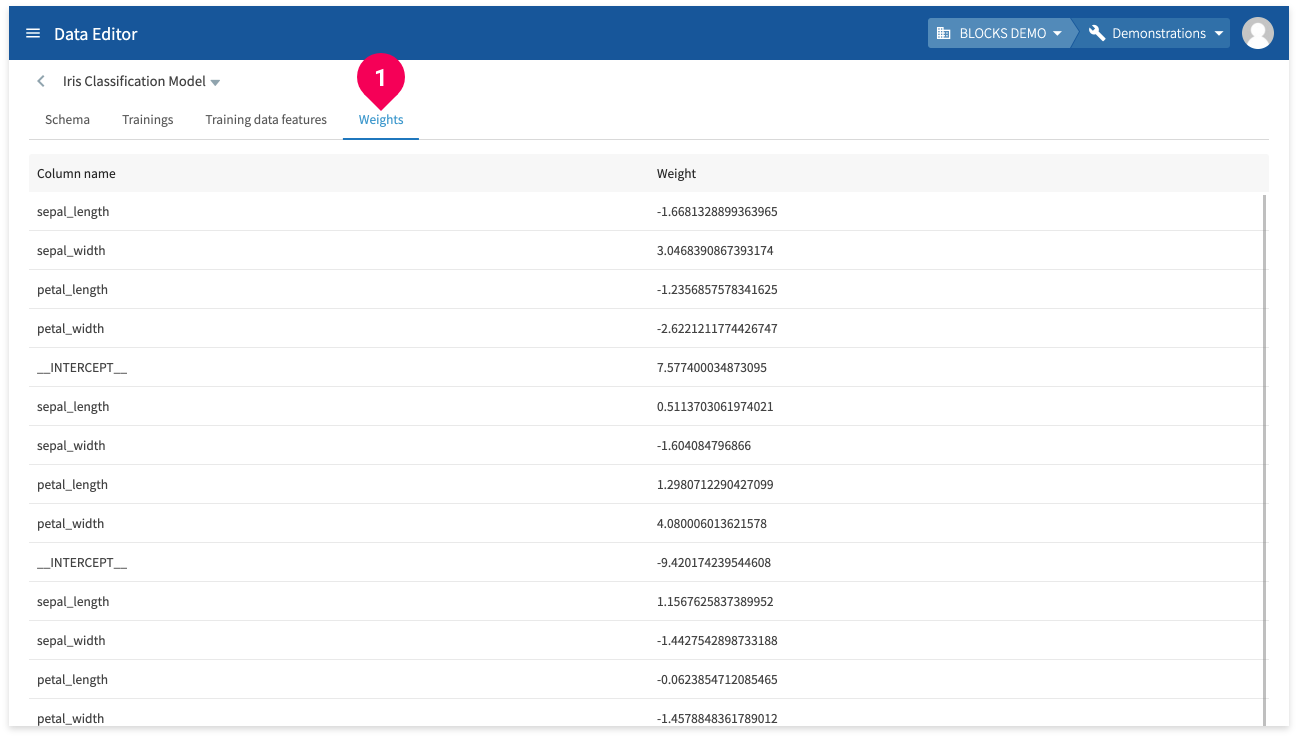
Click Weights to view the weight of each column.
If the model’s results are not good enough, you can reevaluate your training data features and create a new models until you create one that meets your needs.
Making predictions
If there are no problems with the contents of your model, you can use it to make predictions by doing the following:
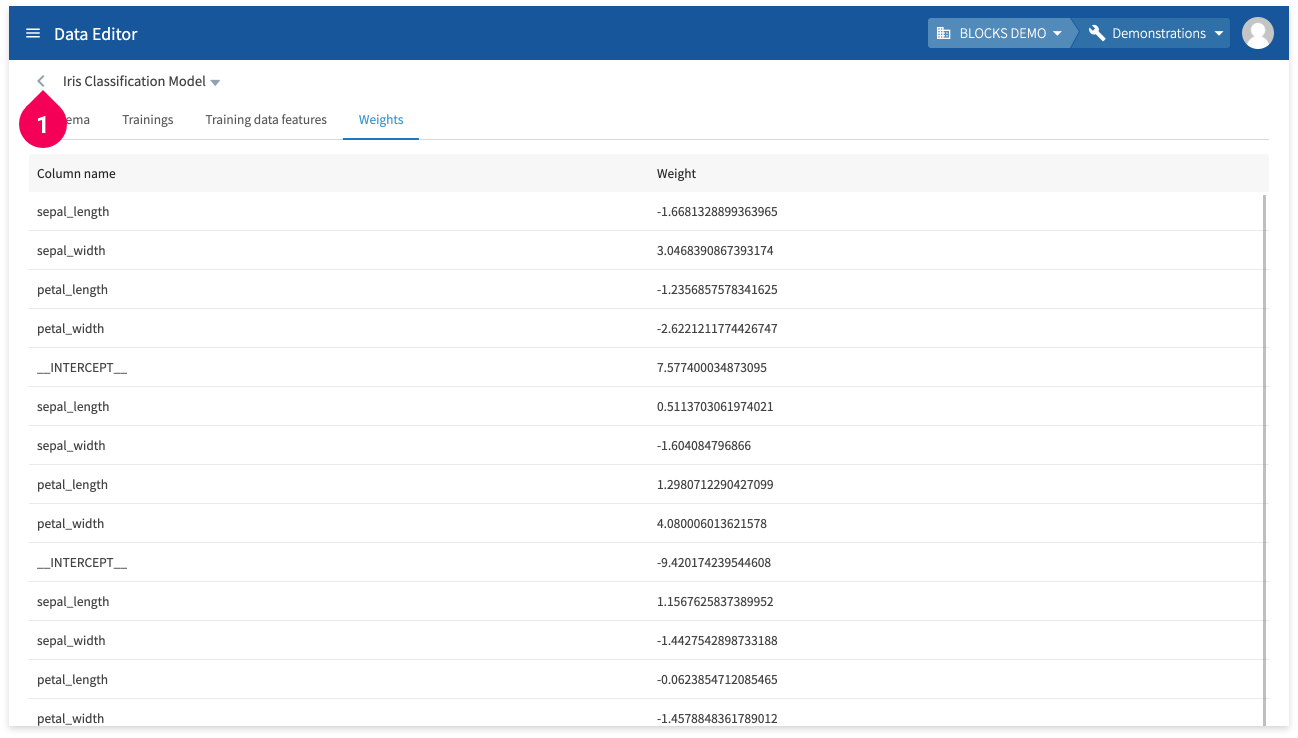
- Click <.

- Click Data.

- Click Iris Classification Data_test.

- Click Predict.
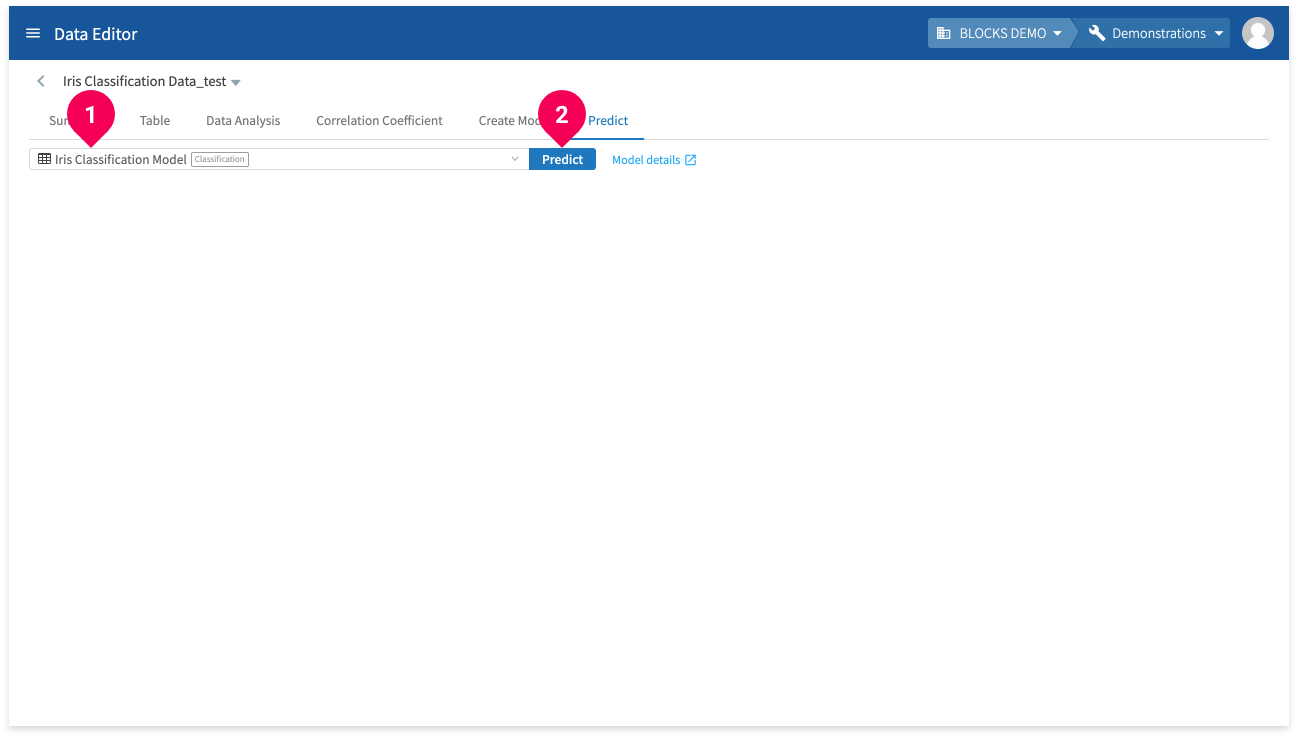
- Click Iris Classification Model.
- Click Predict.
The results will appear after a bit of time.
You can click Download to download a CSV file of the results.
- If there are multiple pages of results, clicking download will only download the results from the pages you have loaded in the DataEditor.
For example, if there were three pages of results and you clicked to view page two, and then you clicked Download, the download would include the results from pages one and two.
- The result column for each label (predicted_label_probs) is not included.
Clustering example
This section will use the iris data from Categorize data with the classification model to demonstrate how to use a clustering model.
Preparing the data
We’ll start by preparing the data we’ll use to train and test the model, which is the same data used in the Categorize data with the classification model tutorial.
If you haven’t followed followed that tutorial and need to prepare the data, complete the steps in the Preparing the data as a CSV file and Splitting the data in the DataEditor sections.
Creating the model
Once your training data is ready, create the model by doing the following:
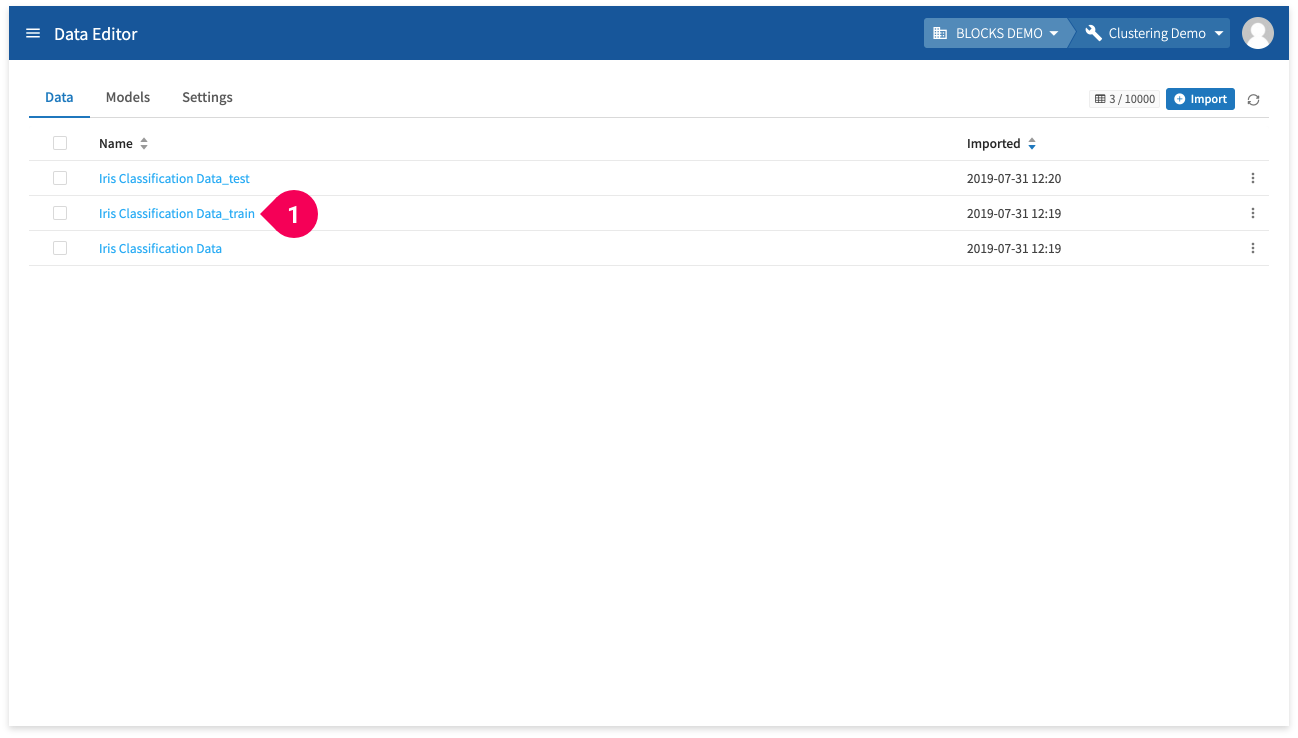
- Click Iris Classification Data_train.
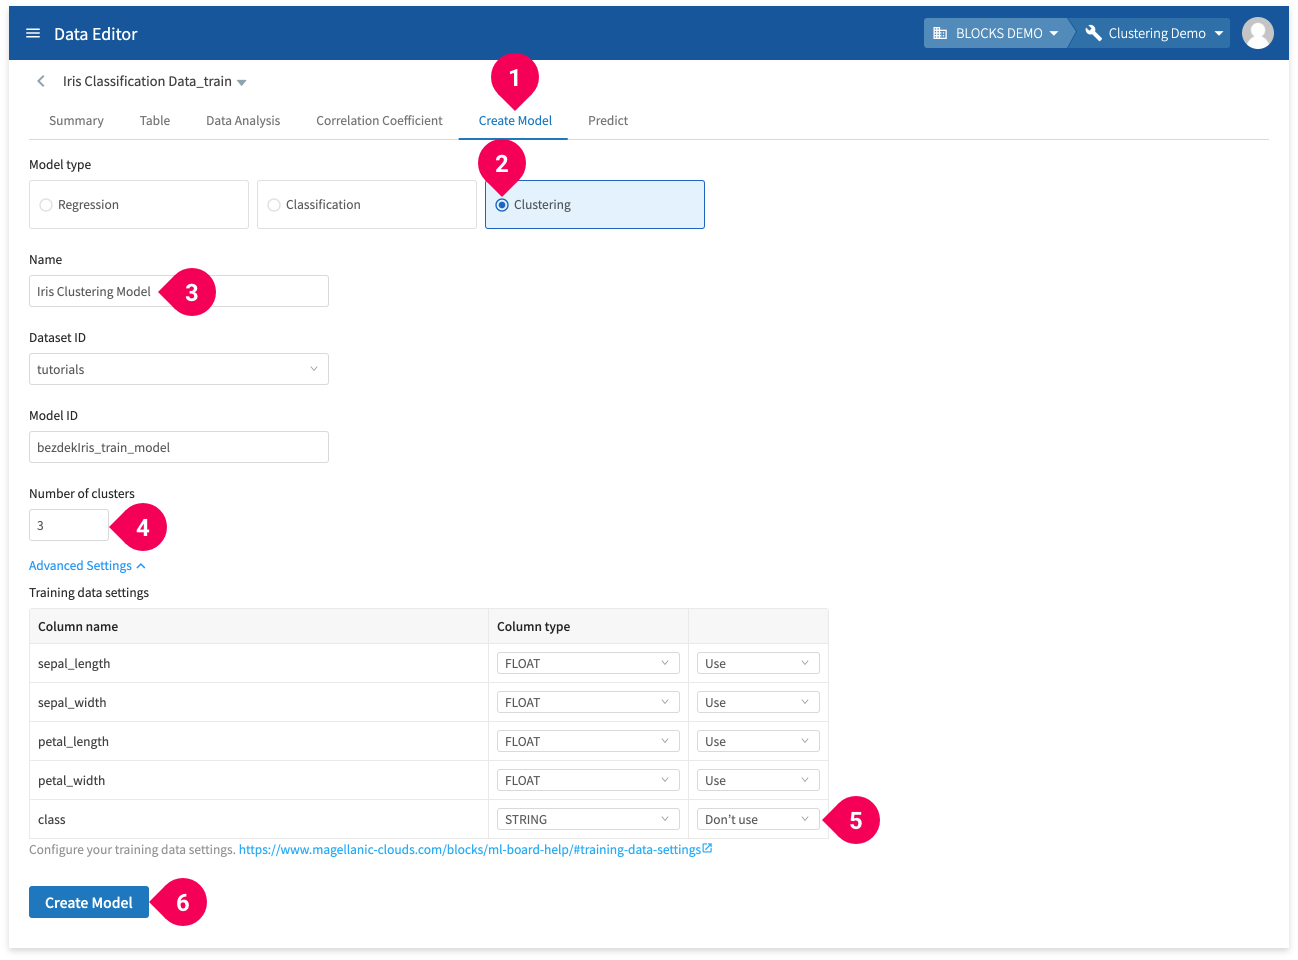
- Click Create Model.
- Click Clustering.
- Change the name to
Iris Clustering Model. - Set the number of clusters to
3. - Click Advanced Settings.
- Change the class column to Don’t Use.
- Click Create Model.
Wait for a bit until BLOCKS finishes creating the model.
info_outline Clustering is a type of unsupervised machine learning, which is why we don’t include the labels (the class column) when training the model.
Checking the model
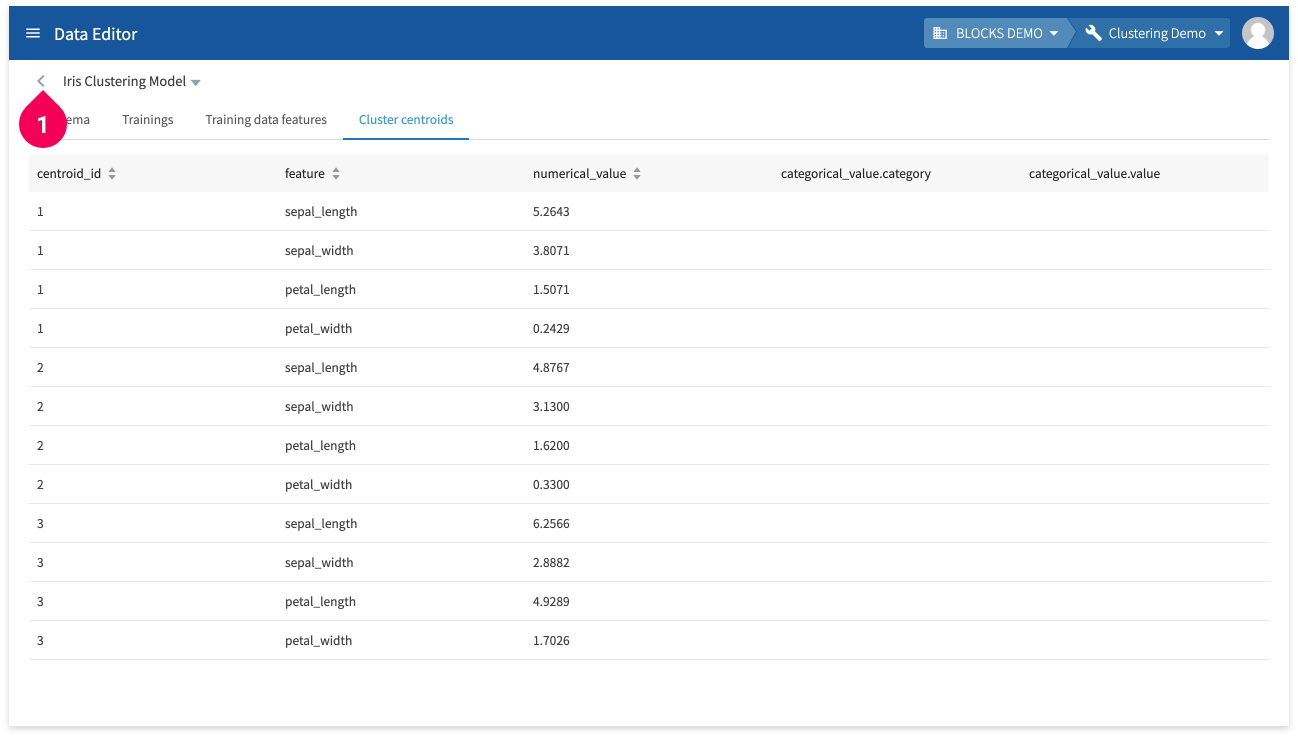
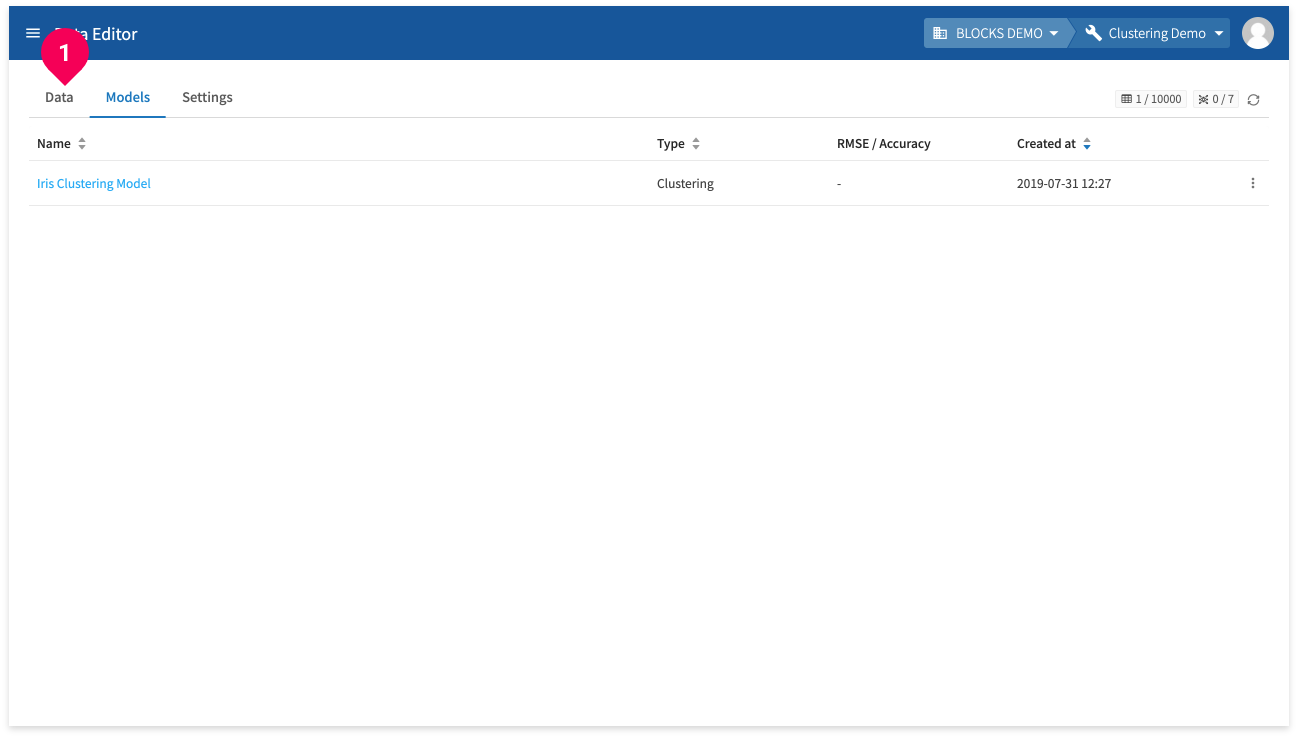
Once the model is created, you can check its contents by doing the following:
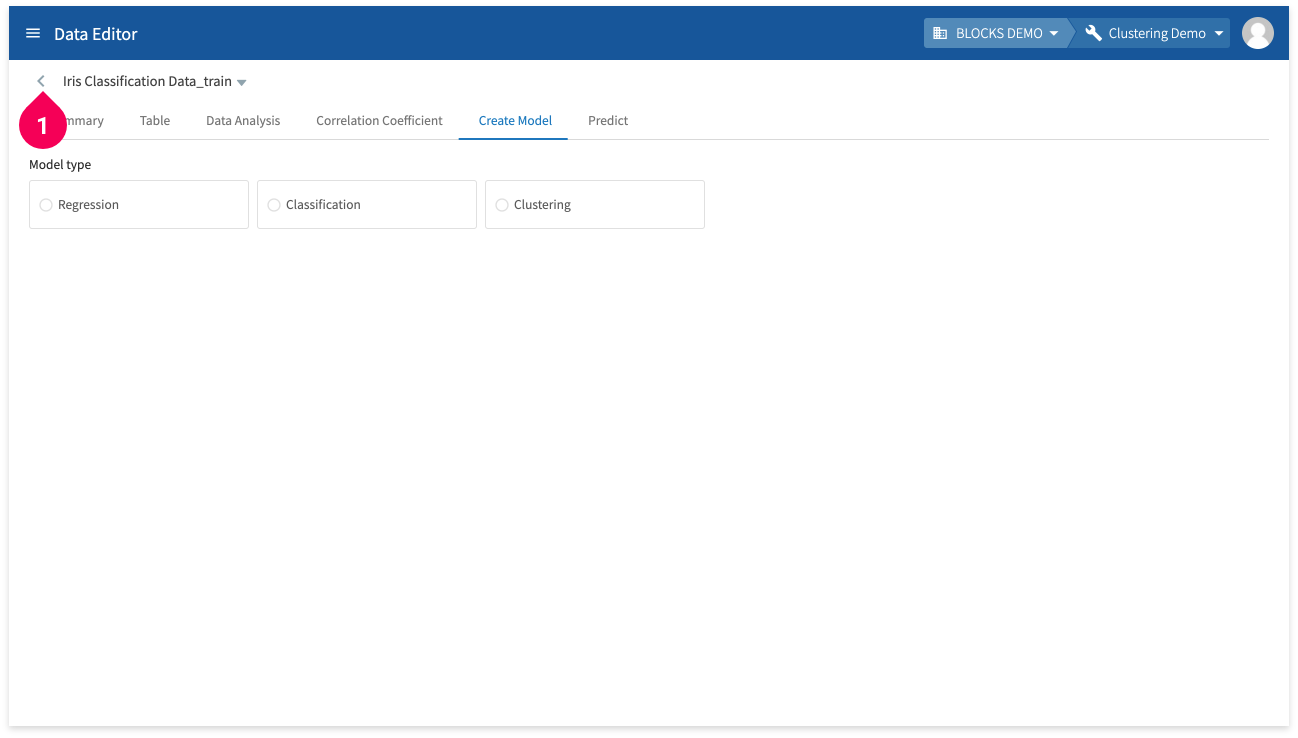
- Click <.
- Click Models.
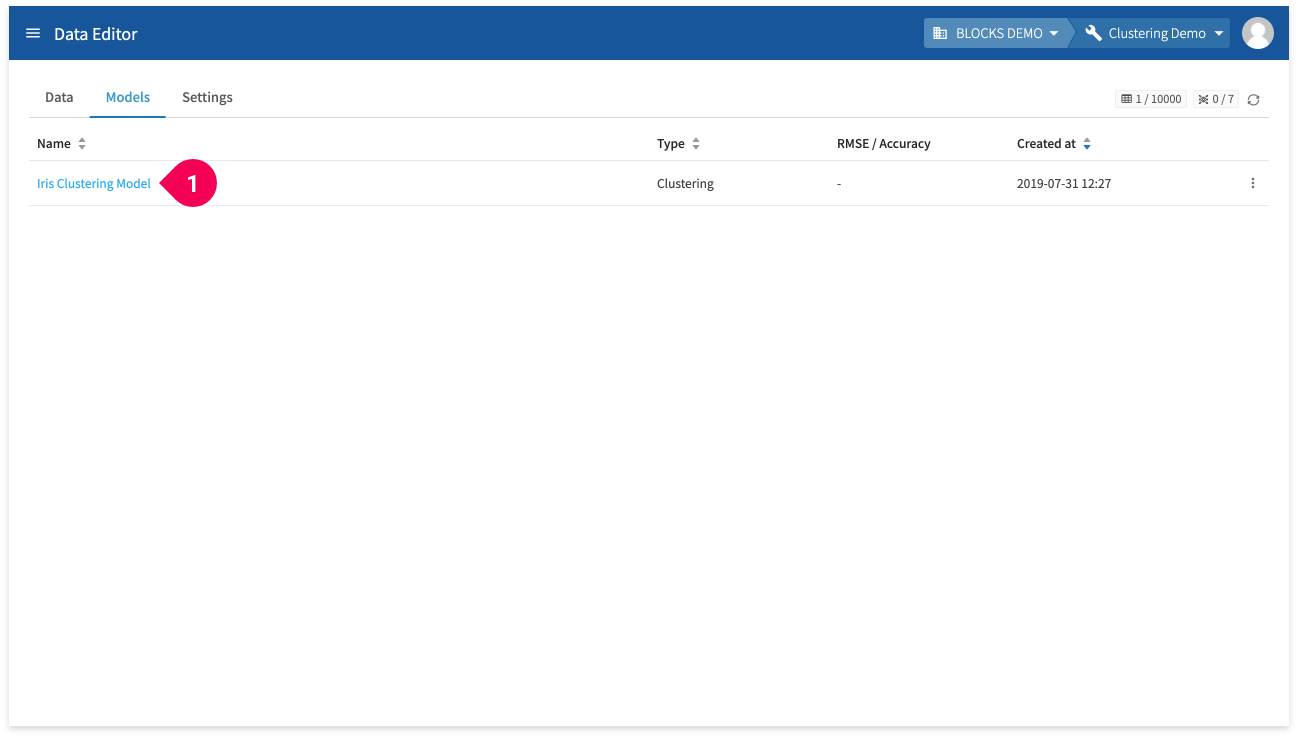
- Click Iris Clustering Model.
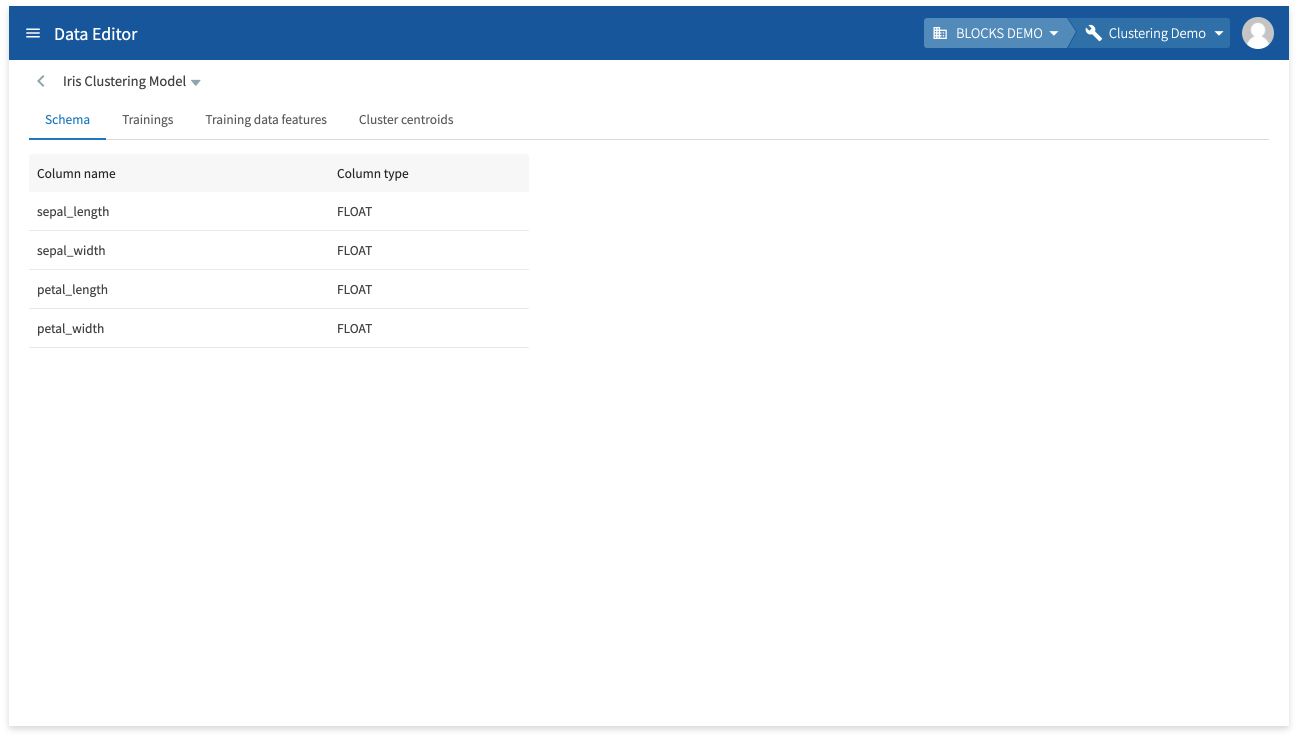
In the Schema tab, you can view the model’s schema information (column names and types).
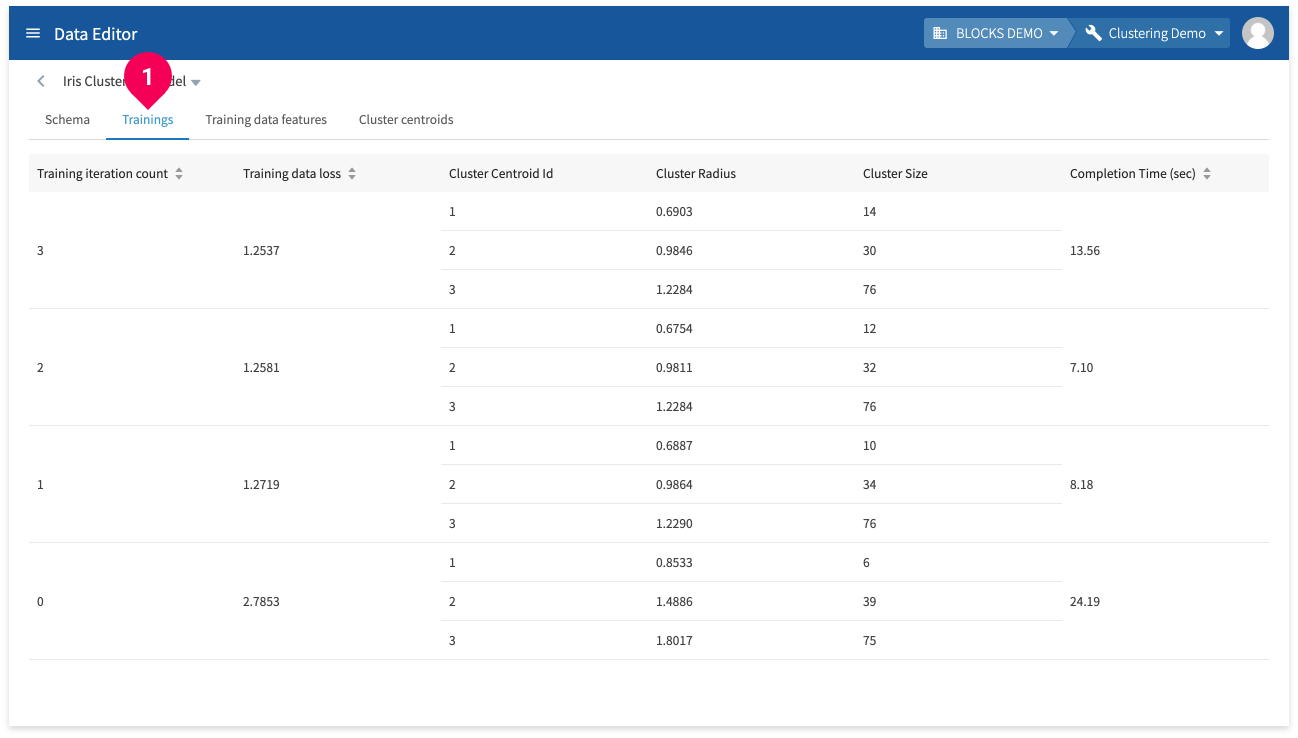
Click Trainings to view the following information about the model’s training:
- Training iteration count: The iteration number of the training.
- Training data loss: The calculated loss (Root Mean Square Error) for the training.
- Cluster centroid ID: IDs for each cluster centroid.
- Cluster radius: The cluster’s radius.
- Cluster size: The size of the cluster.
- Completion time (sec): The amount of time for each training.

Click Training data features (❶) to view the following information for each feature in the training data:
- Column name: Shows the name of each training data column.
- Min: Shows the minimum value for each training data column. Shows NULL if the column doesn’t contain numbers.
- Max: Shows the maximum value for each training data column. Shows NULL if the column doesn’t contain numbers.
- Mean: Shows the mean value for each training data column. Shows NULL if the column doesn’t contain numbers.
- STDDEV: Shows the standard deviation for each training data column. Shows NULL if the column doesn’t contain numbers.
- Category count: Shows the number of categories. Shows NULL if the column doesn’t contain categorical data.
- NULL count: Shows the number of NULL entries.
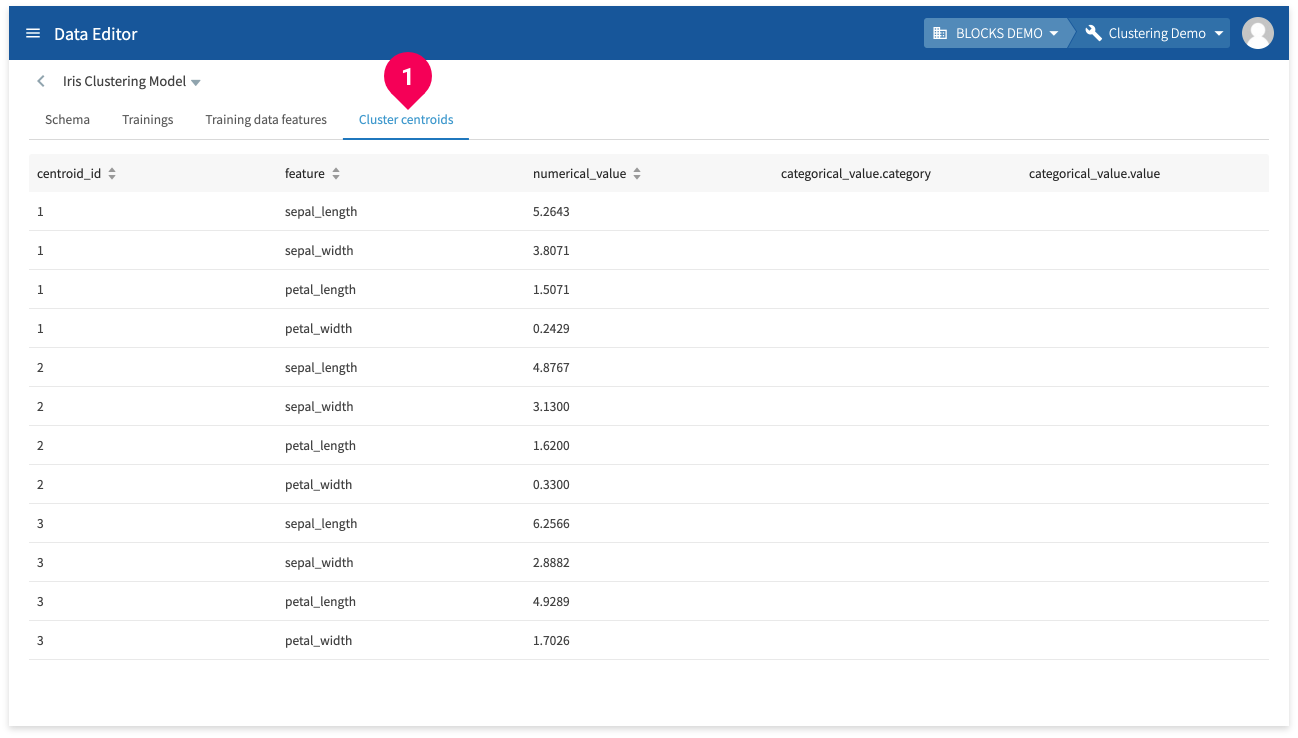
Click Cluster centroids to view the following information:
- centroid_id: IDs for the cluster centroids.
- feature: The column names.
- numerical_value: If the feature contains numbers, this shows a value for the centroid. This contains NULL for non-numerical types.
- categorical_value.category: If the feature contains STRING-type data, this shows the string that is the centroid. This will be blank for numerical-type columns.
- categorical_value.value:The level of confidence for the centroid in categorical_value.category shown as a value between 0–1.
Making predictions
If there are no problems with the contents of your model, you can use it to make predictions by doing the following:
- Click <.
- Click Table.
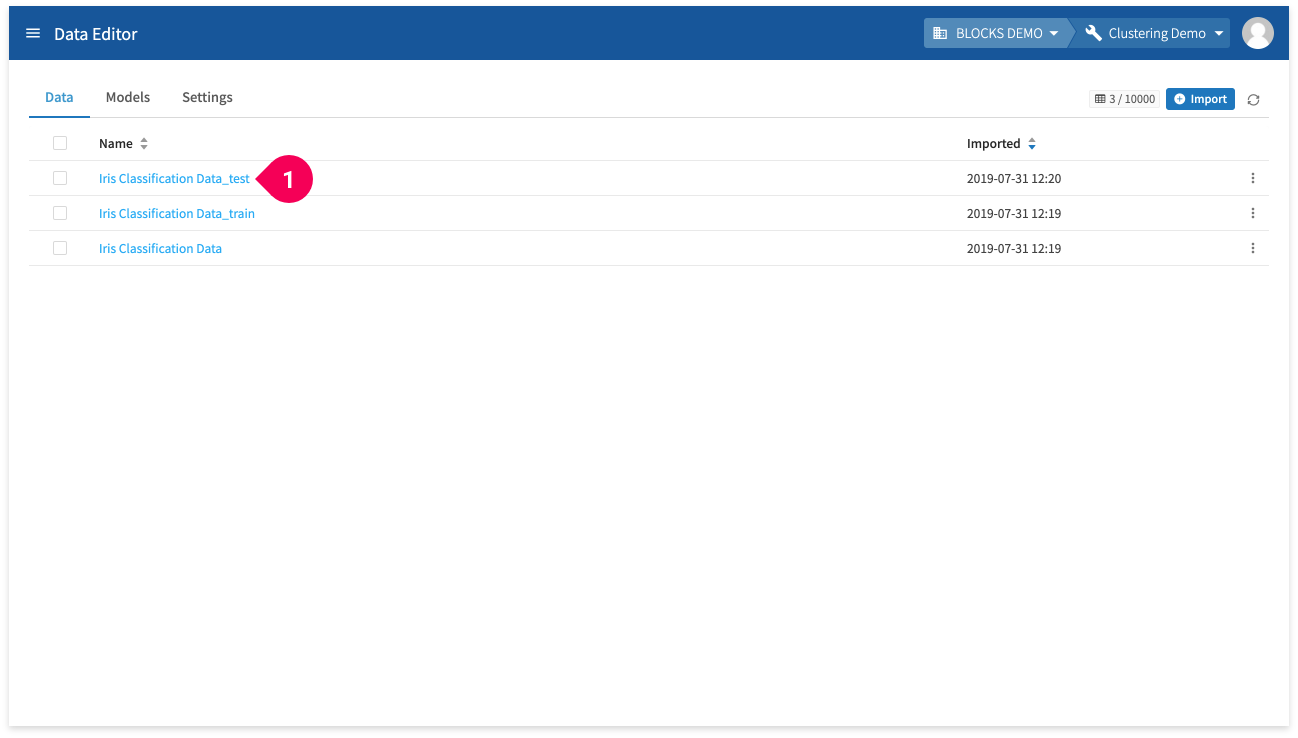
- Click Iris Classification Data_test.
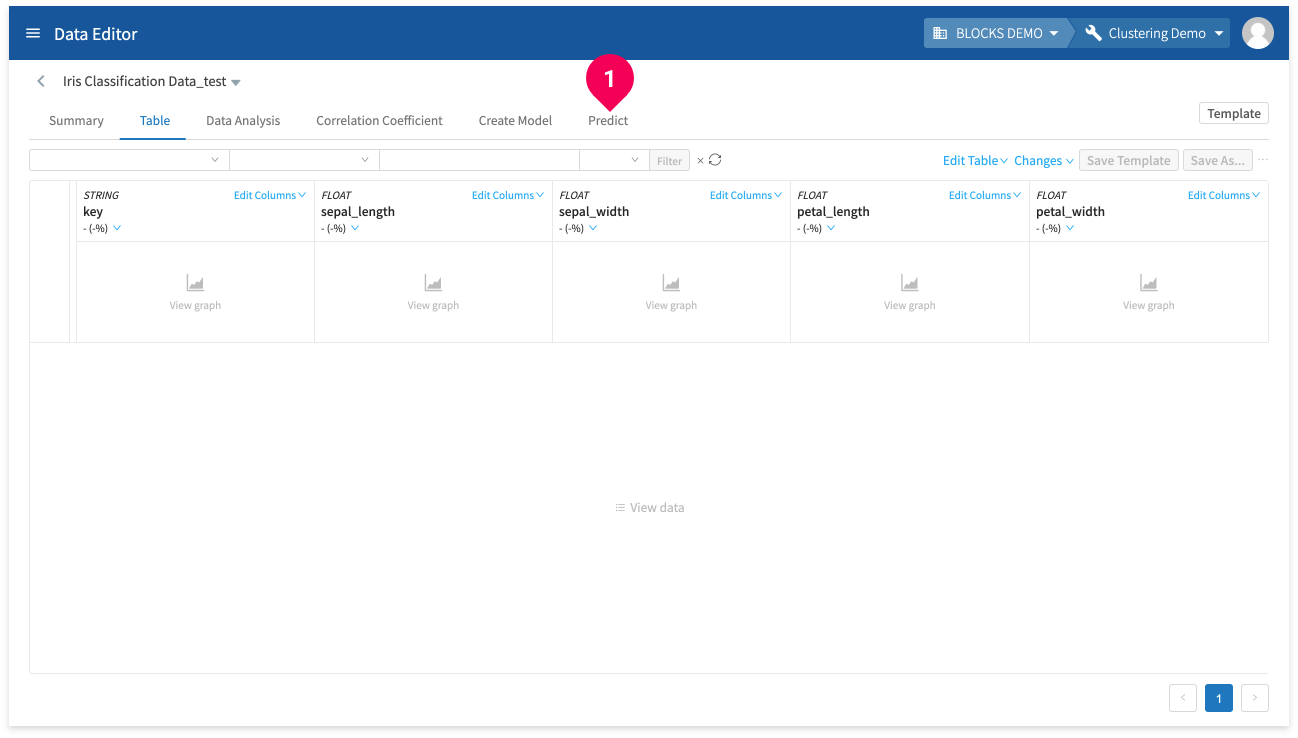
- Click Predict.
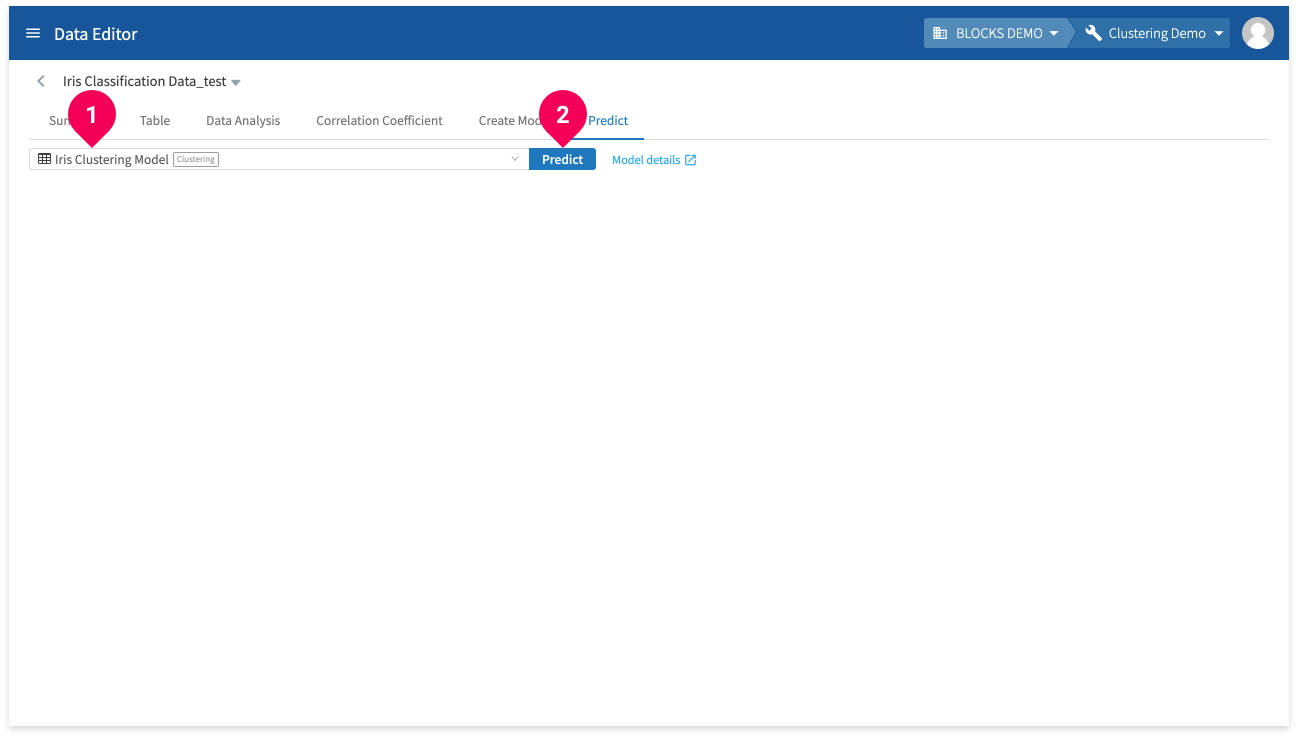
- Click Iris Clustering Model.
- Click Predict.
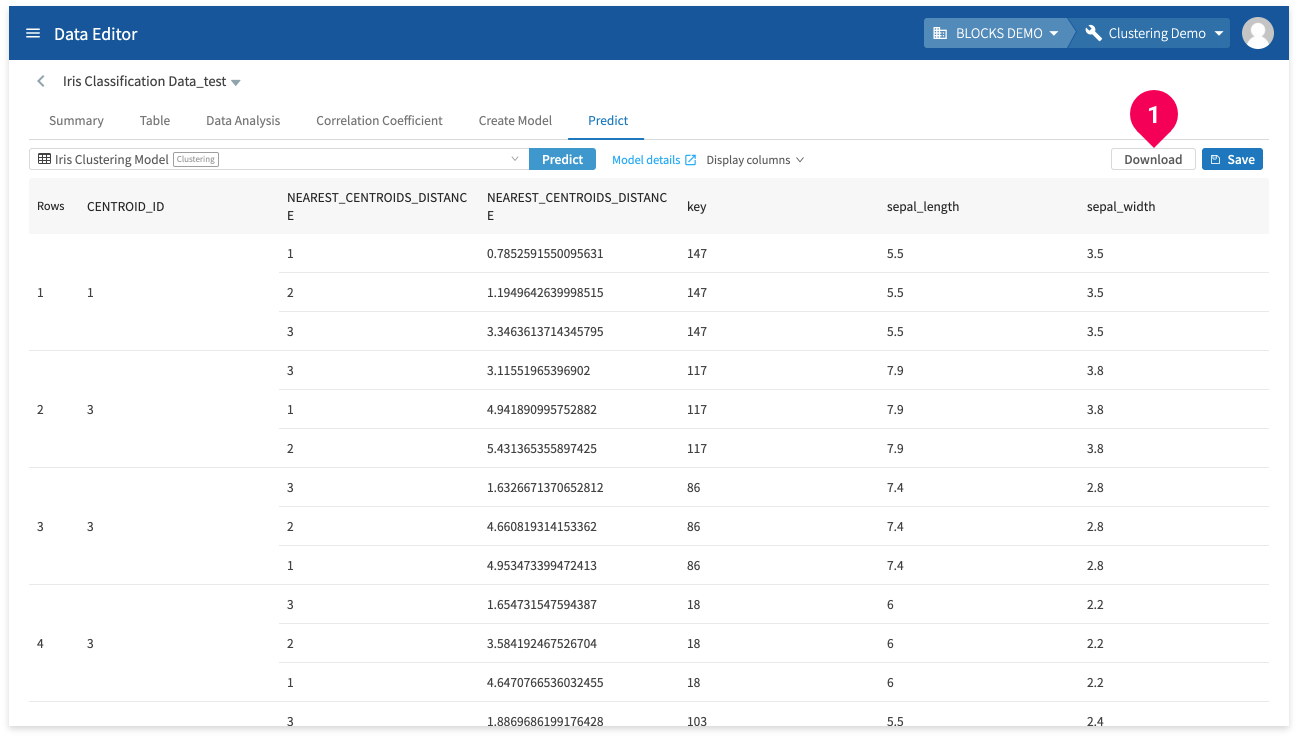
The results will appear after a bit of time.
You can click Download to download a CSV file of the prediction results.
- If there are multiple pages of results, clicking download will only download the results from the pages you have loaded in the DataEditor.
For example, if there were three pages of results and you clicked to view page two, and then you clicked Download, the download would include the results from pages one and two.
- The NEAREST_CENTROIDS_DISTANCE column is not included in the downloaded data.