Introduction
The DataEditor is tool for processing data with a visual interface. You can use it to prepare your data for Machine Learning trainings and predictions.
You can import data into the DataEditor from BigQuery, Google Sheets, or as CSV files.
The DataEditor stores and processes your data using BigQuery, but you don’t need to have specialized knowledge of BigQuery to use the DataEditor.
info_outline While you don’t need to have any specialized knowledge of BigQuery to use the DataEditor, you will need to specify the BigQuery dataset and table that will store your data. If you are familiar with spreadsheet software, a BigQuery dataset could be compared to a workbook, and a BigQuery table to a single sheet.
Opening the DataEditor
After signing in to BLOCKS, you can access the DataEditor by doing the following:
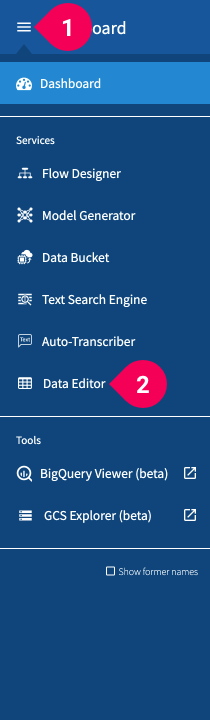
- Click the menu icon (menu) in the global navigation bar.
- Click DataEditor.
Features
This section will briefly explain the following main features of the DataEditor:
- Importing data
- Using the editor
- Merging tables
- Splitting tables
- Exporting
- Copying schema info
- Deleting data
- Settings
Importing
You can import data into the DataEditor by doing the following:
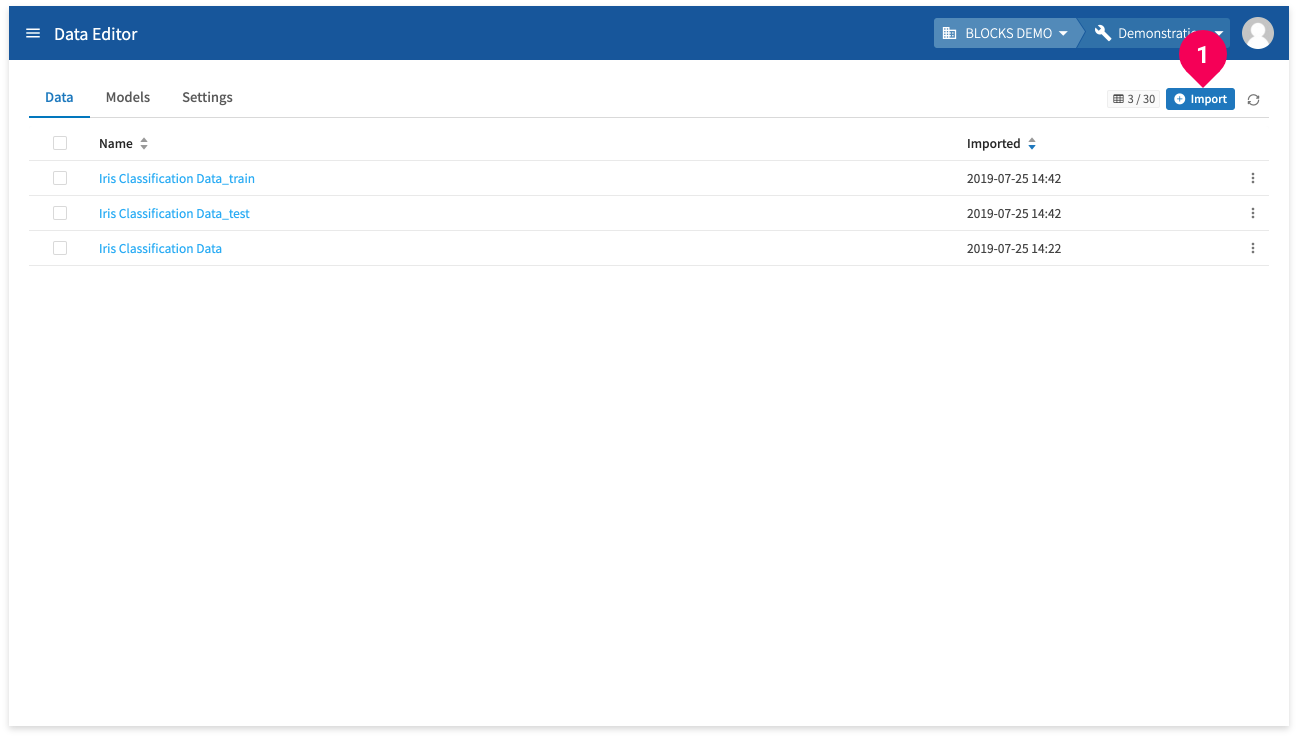
- Click Import.
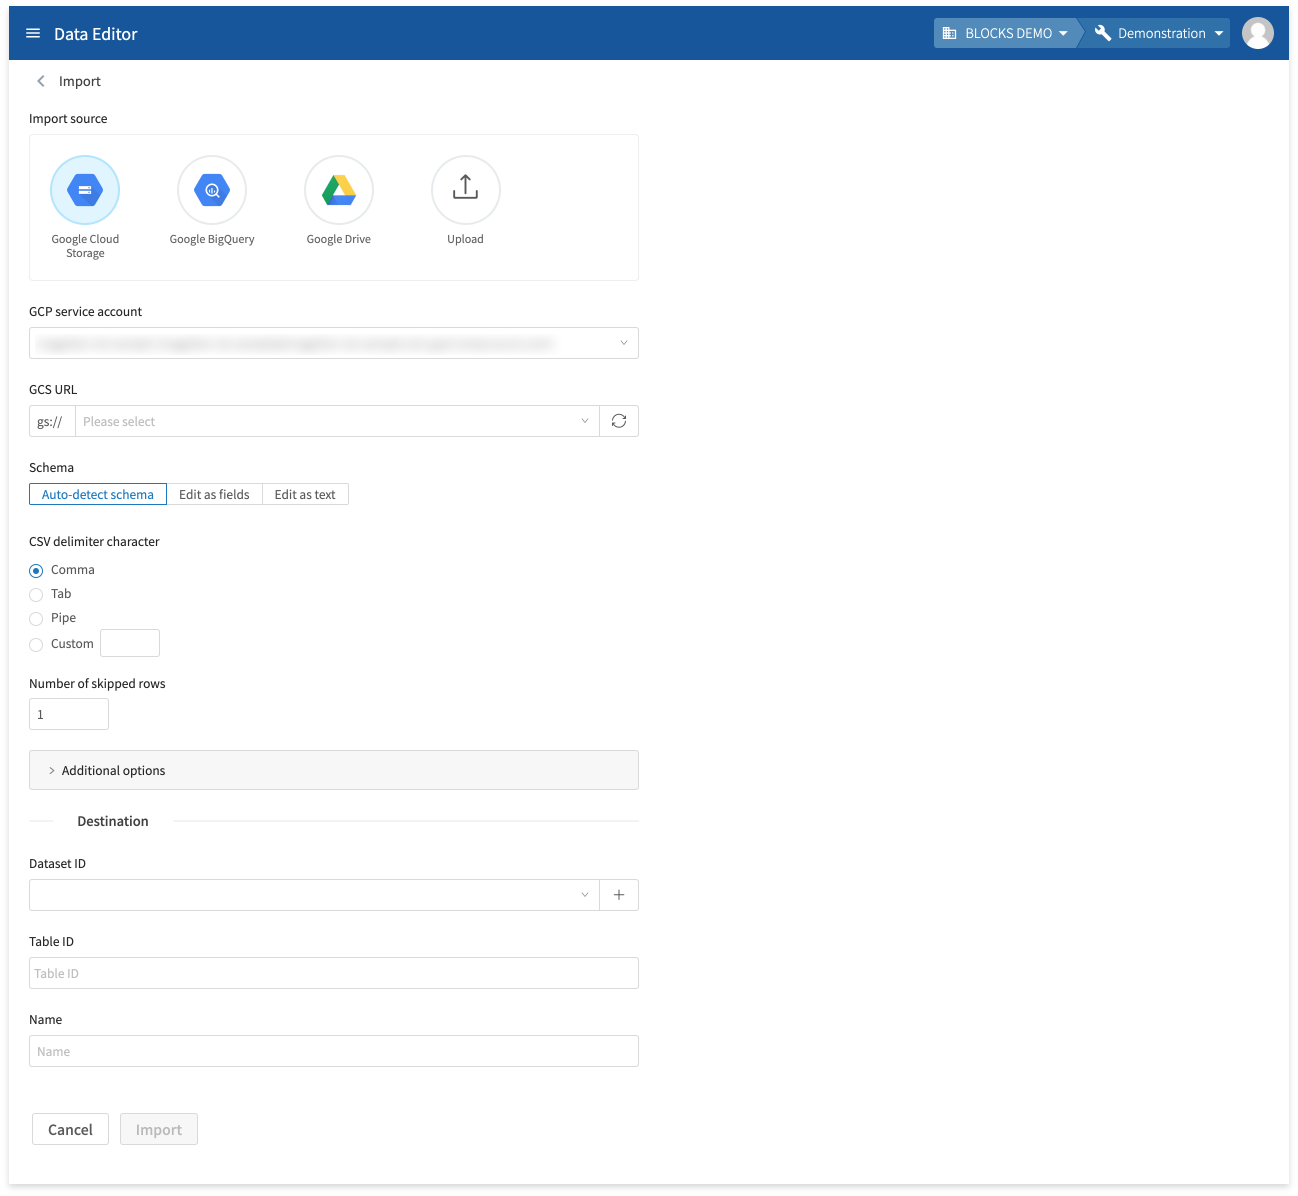
Select where your data is currently stored and configure the settings for importing it into the DataEditor. You can import the following types of data:
- Google Cloud Storage: CSV files stored in Google Cloud Storage (GCS).
- Google BigQuery: BigQuery tables.
- Google Drive: CSV files or Google Sheets stored in Google Drive.
- Upload: CSV files stored in your PC.
Using the editor
You can edit data in the DataEditor by doing the following:
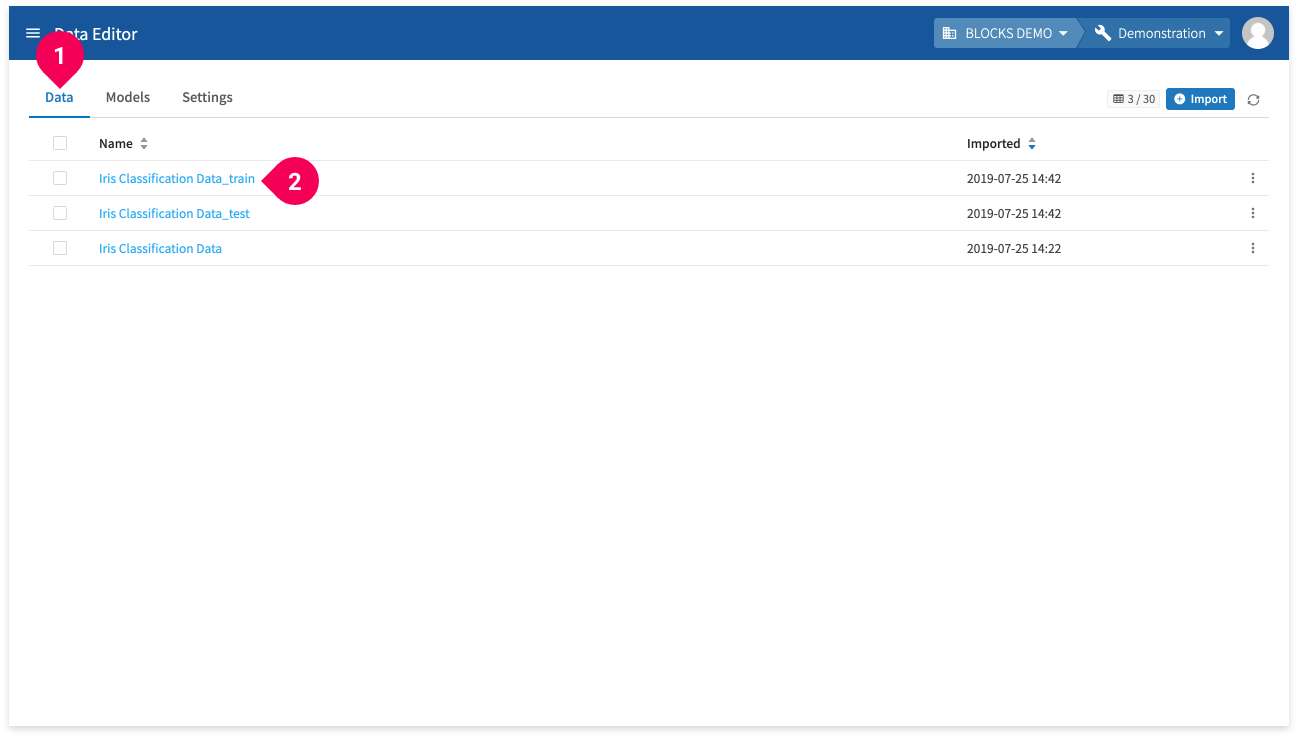
- Click the Data tab.
- Click the name of the data you want to edit.
You can do the following within the editor:
- View summaries
- View graphs
- View data
- Edit columns
- Add columns
- Add sequence data columns
- Concat columns
- Templates
- Data analysis
- Correlation coefficients
- Create models
- Make predictions
View summaries
You can view various aggregates for your data by doing the following:
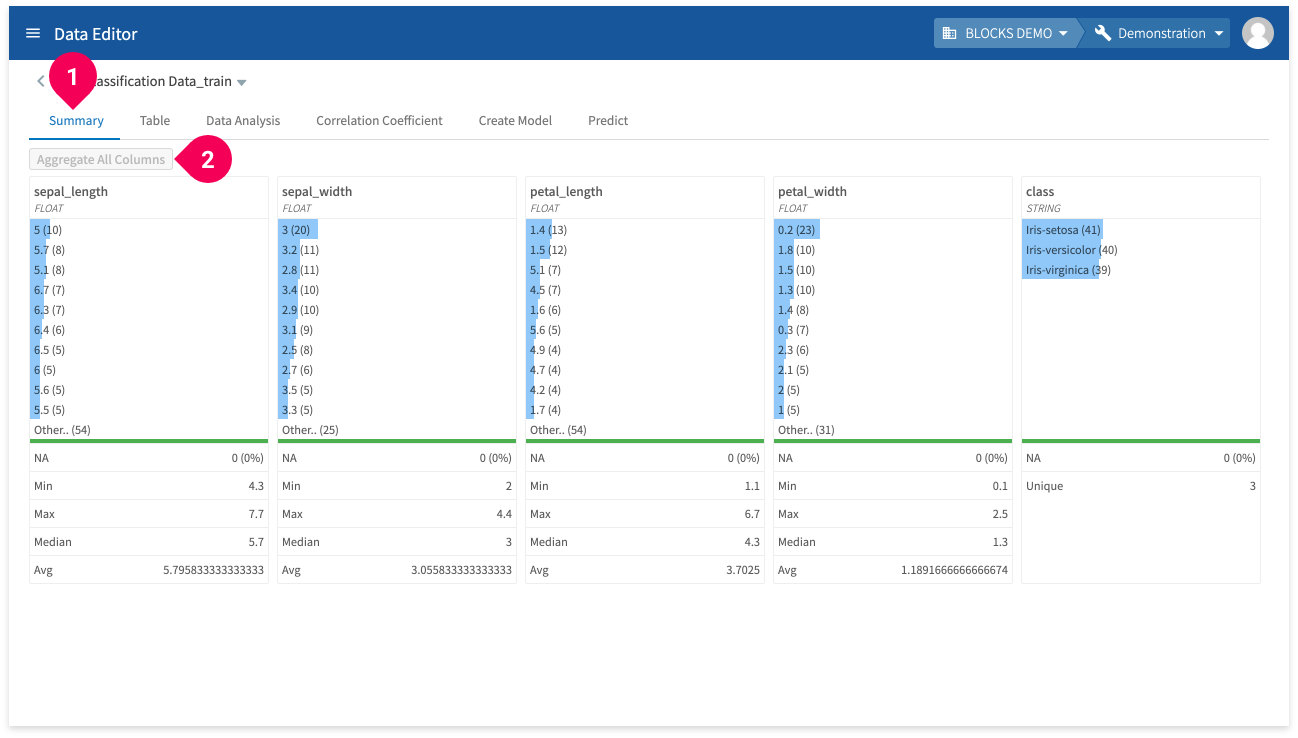
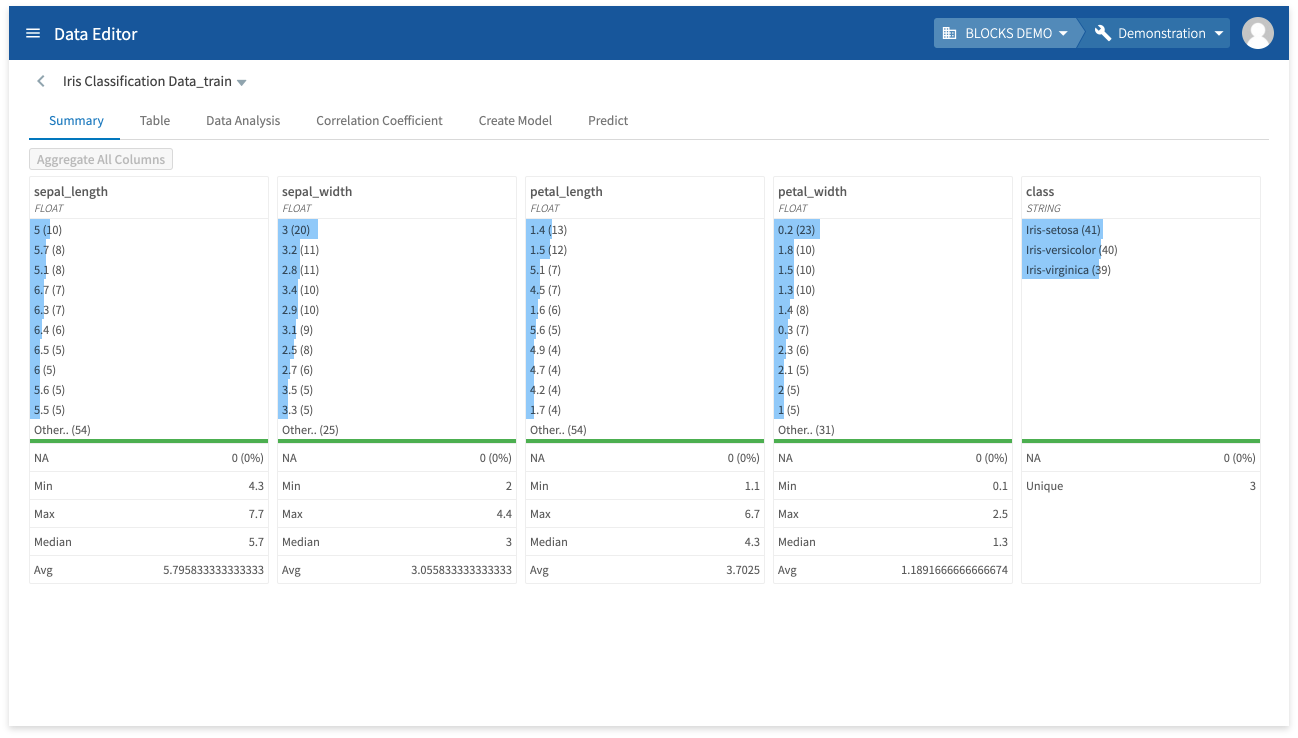
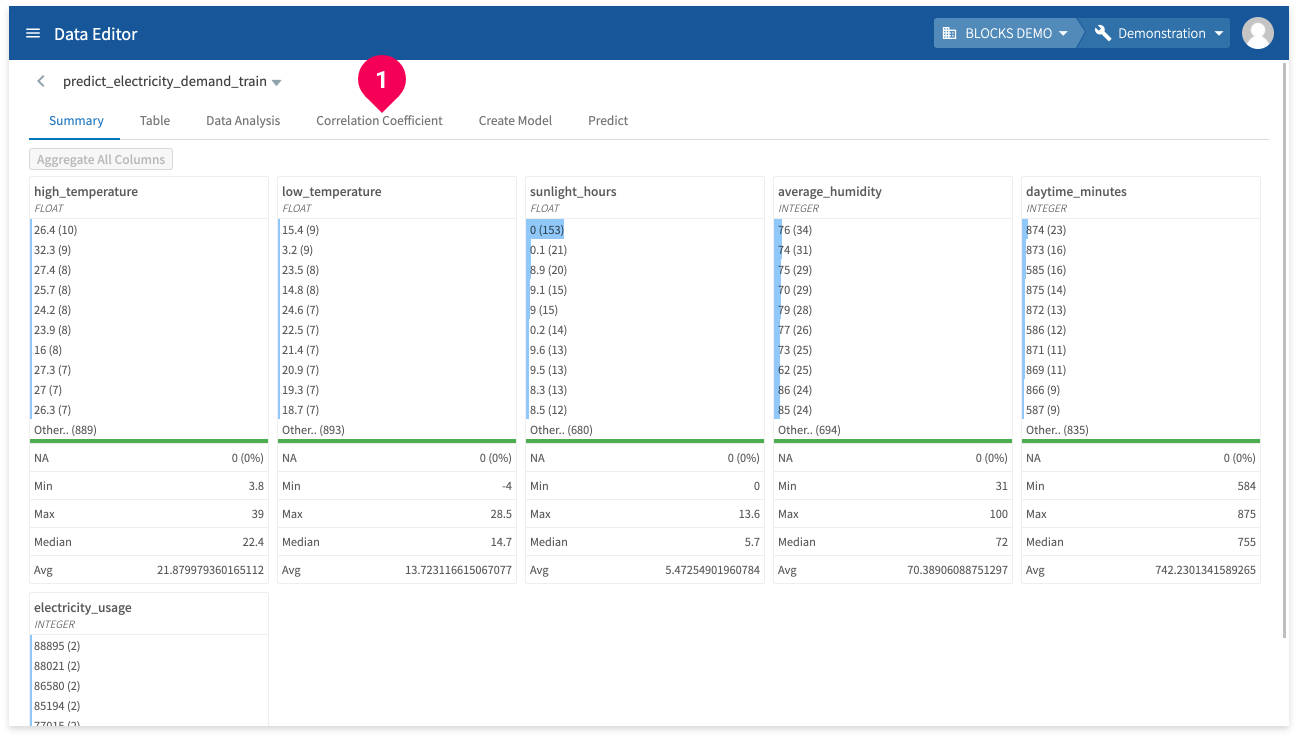
- Click Summary.
The summary tab contains the following information for each column in your data:
- The top 10 most frequently occuring values with the number of instances shown in parentheses.
- The number and percentage of missing values.
- The minimum value.
- The maximum value.
- The median value.
- The average value.
- The number of unique values.
Click Aggregate All Columns to calculate these aggregates. They will be automatically aggregated when you import data into the DataEditor, but you will need to use this button if you update your data.
View graphs
You can view graphs representing the distribution of values in your data by doing the following:
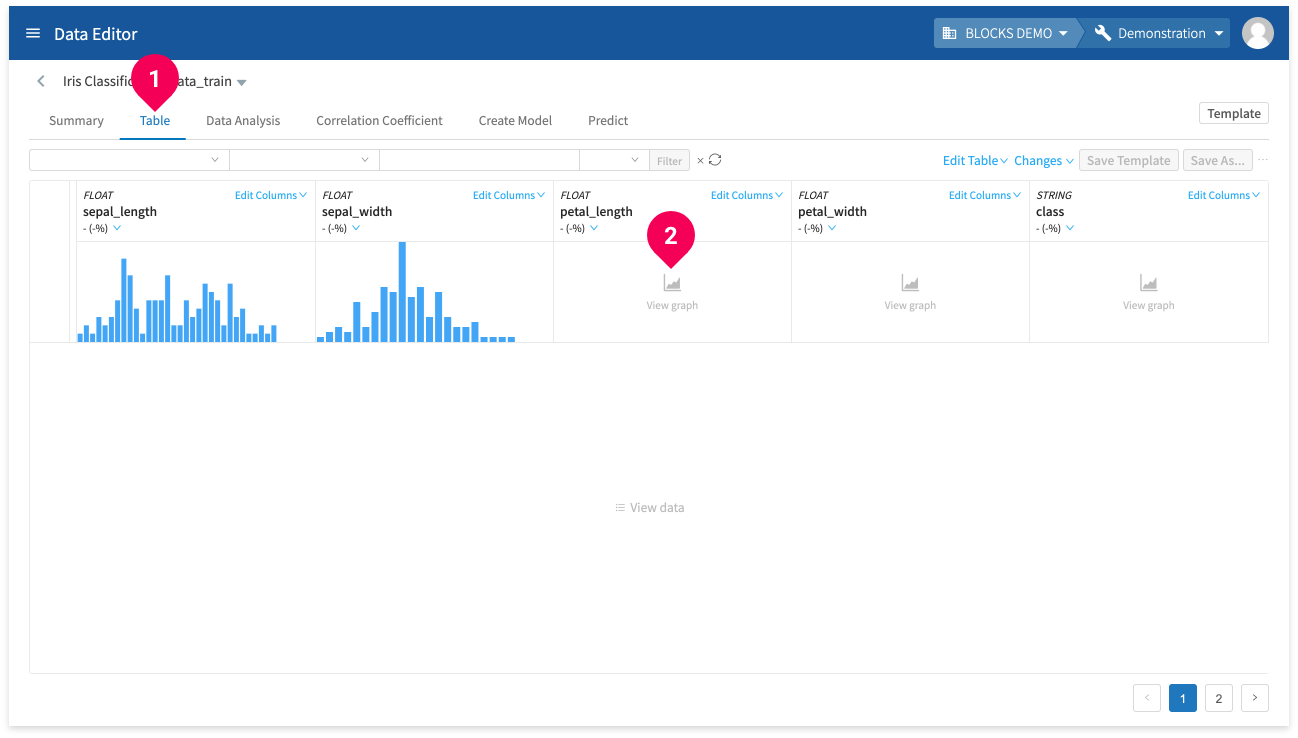
- Click Table.
- Click View graph for a column.
This will create a graph to visually represent the distribution of values in the selected column.
info_outline Missing values are shown in red.
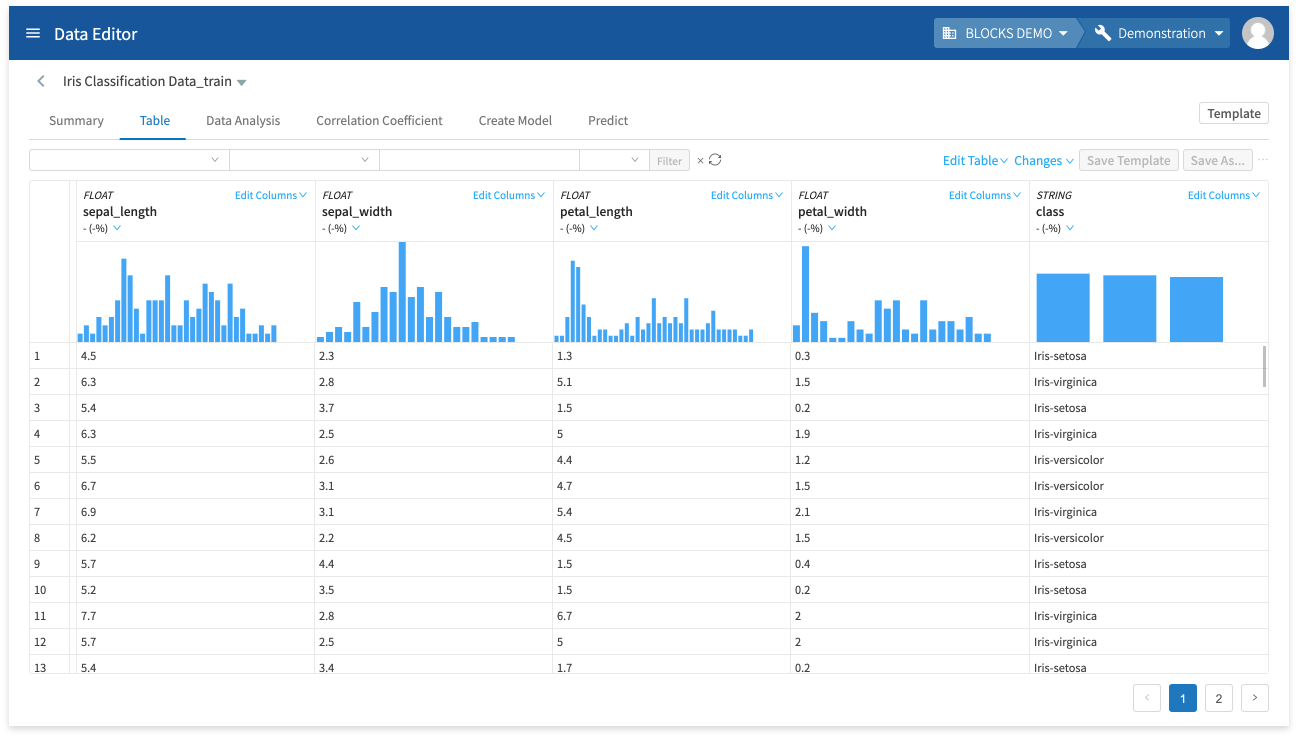
View data
You can view your data as a table by doing the following:
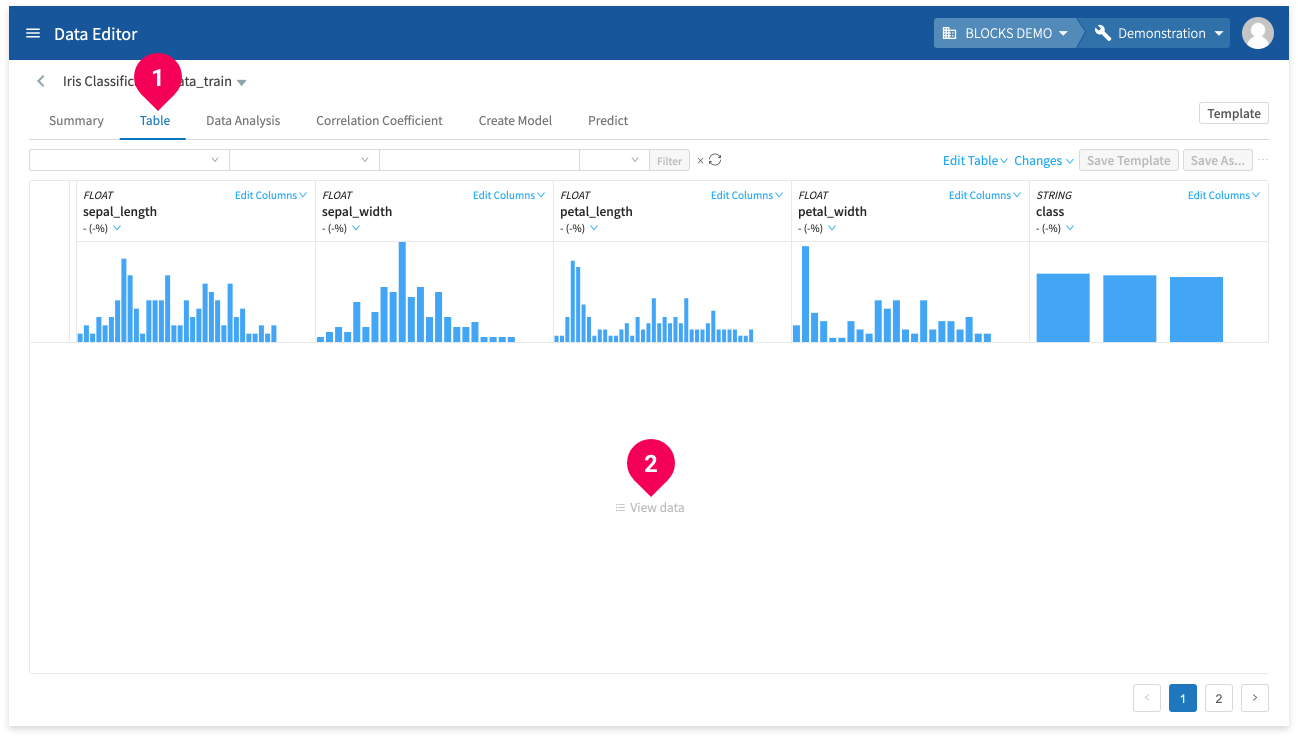
- Click Table.
- Click View data.
This will create a table of your data as shown below:
Edit columns
You can access the Edit column menu by doing the following:
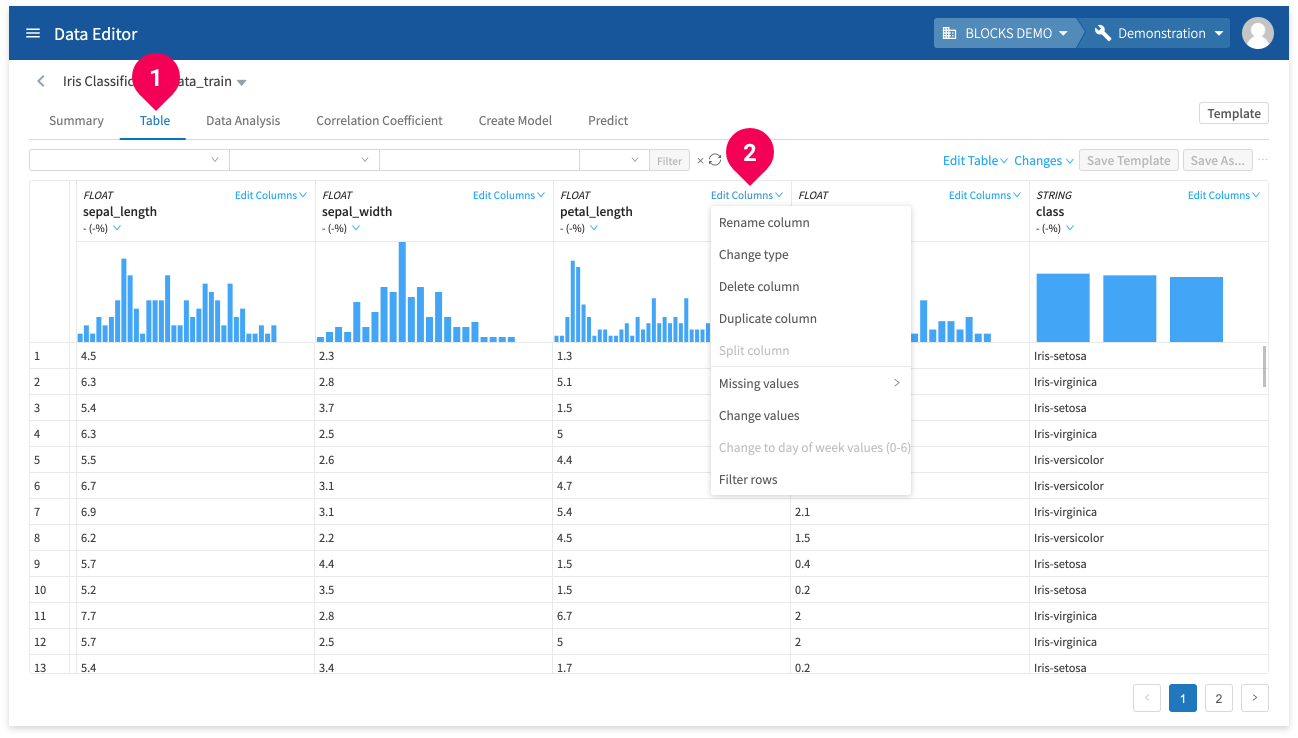
- Click Table.
- Click Edit column.
Any edits that you make in this menu will not be reflected in the actual data until you either Save your edited data with a new name or overwrite your existing data. You can cancel any of edits you make up until you save.
You can do the following from the Edit column menu:
- Rename column
Rename the selected column.
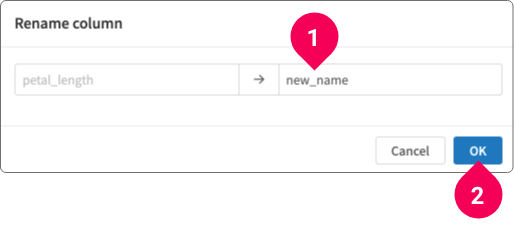
- Enter a new name for the column.
- Click OK.
- Change type
Change the data type for the column.
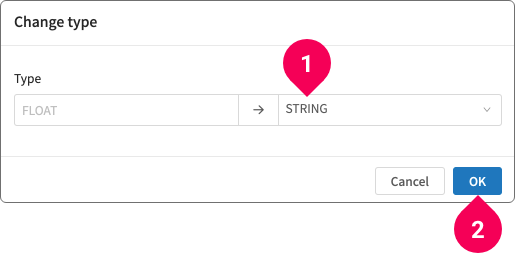
- Select the new data type for the column.
- Click OK.
- Delete column
Delete the column.
- Duplicate column
Duplicate the column.
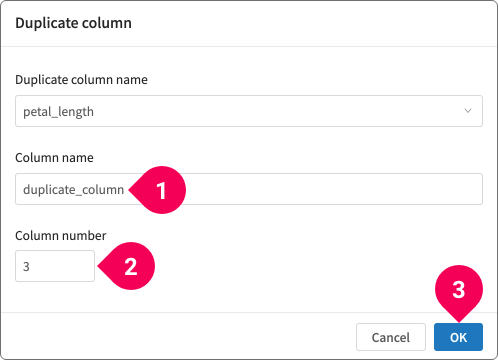
- Enter a name for the new column.
- Select the position where the new column will be placed.
- Click OK.
- Split column
Split a STRING-type column into multiple columns.
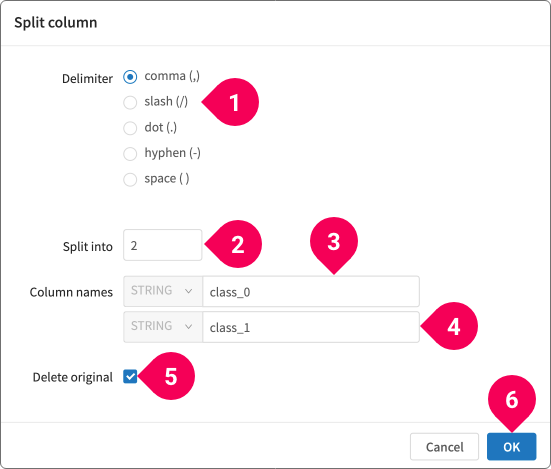
- Select the delimiter character.
- Enter the number of columns to split the original column into.
- Enter a name for each new column.
- Select whether or not to delete the original column. The original column is deleted by default.
- Click OK.
- Delete rows with missing values or replace missing values
Before you can edit missing values in your data, you must do the following:
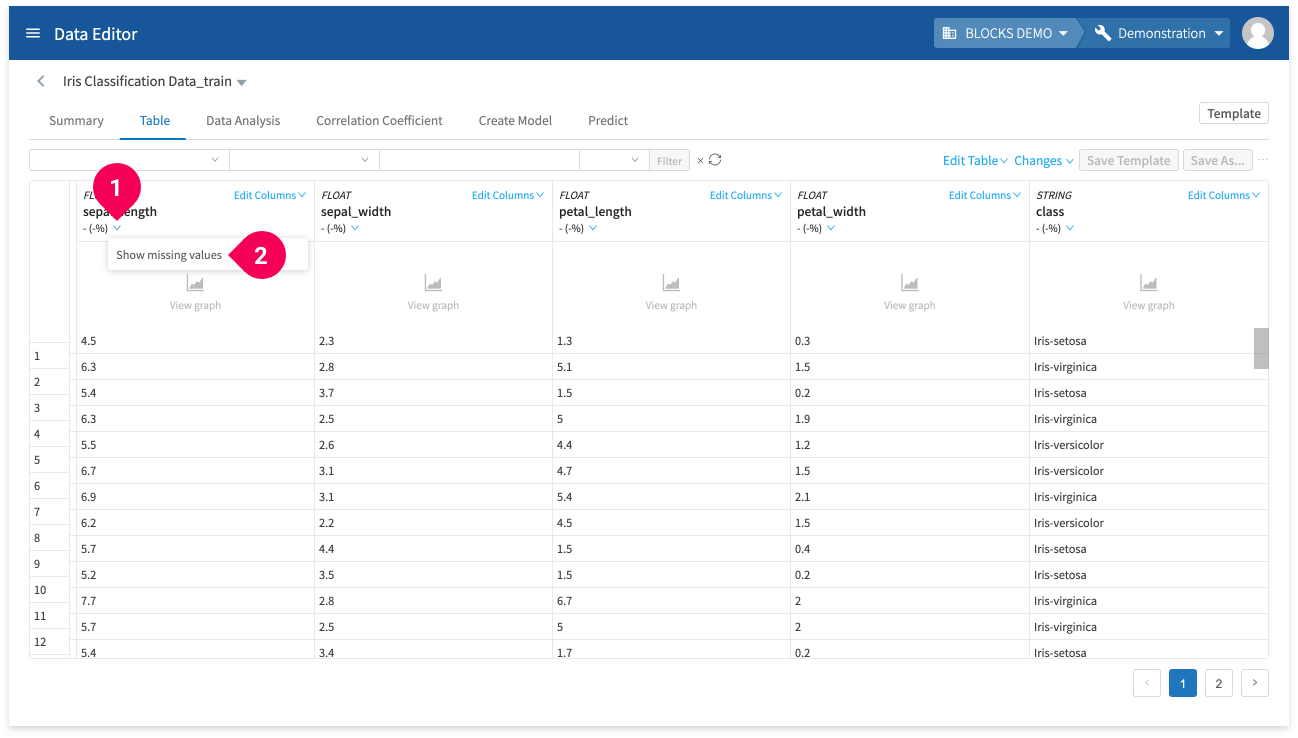
- Click keyboard_arrow_down.
- Click Show missing values.
You can then select how to edit a column that contains missing values by doing the following:
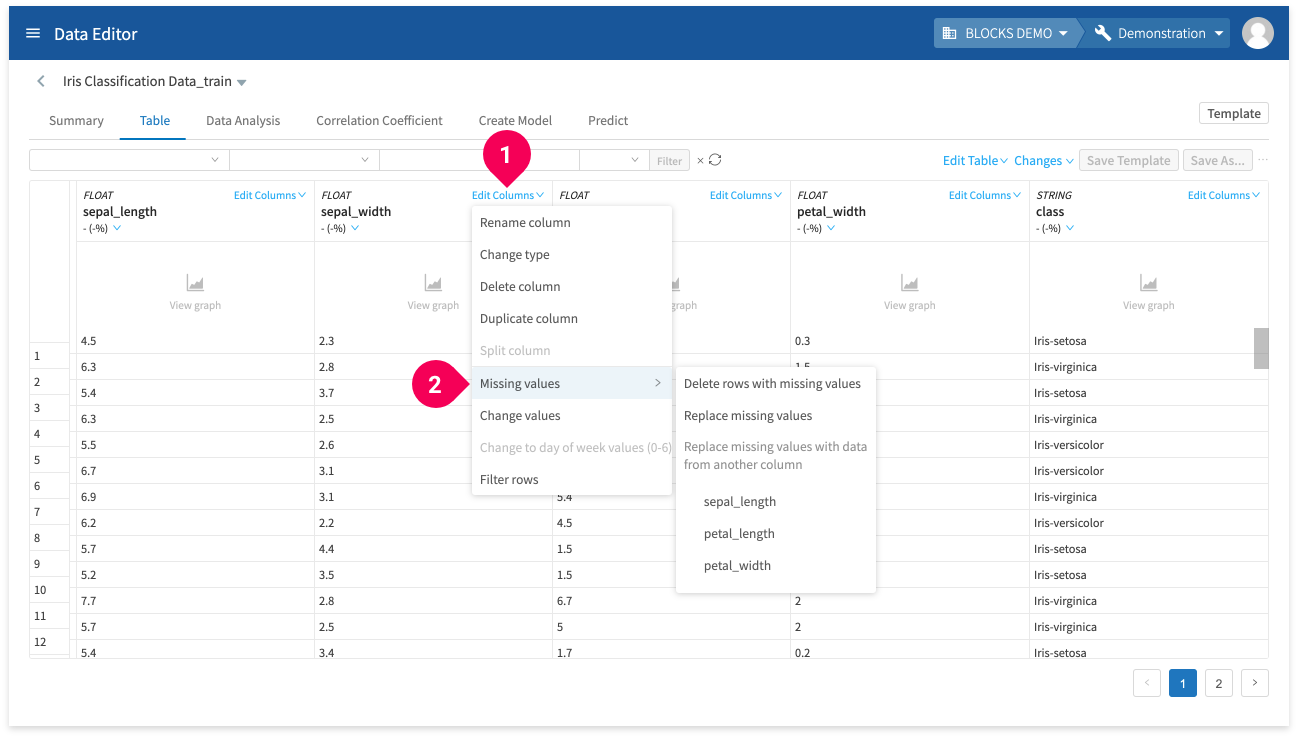
- Click Edit column.
- Click Missing values.
- Click either Delete rows with missing values, Replace missing values, or Replace missing values with data from another column.
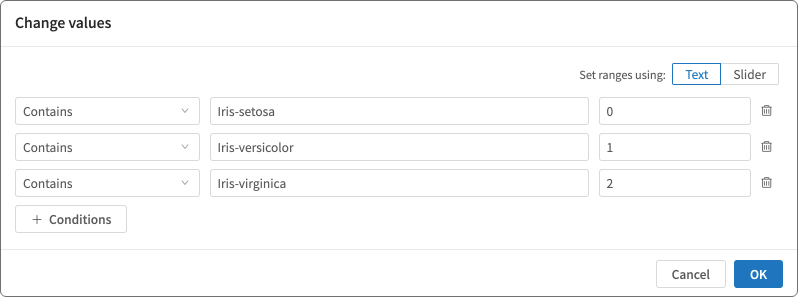
- Change values
Change values in the column according to conditions you configure.
- Change to day of week values (0–6)
Change STRING, DATE, DATETIME, or TIMESTAMP data for dates into the following values signifying the day of the week:
Value Day of the week 0 Sunday 1 Monday 2 Tuesday 3 Wednesday 4 Thursday 5 Friday 6 Saturday STRING data formatted as
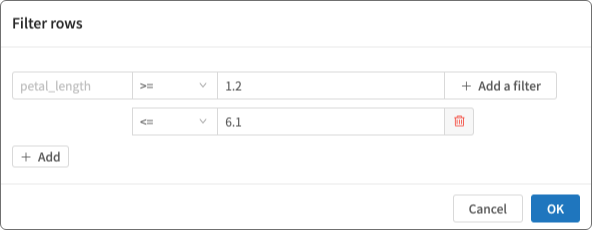
YEAR-MONTH-DATE HOUR:MINUTES:SECONDScan be converted. - Filter rows
Set conditions to refine which rows to display.
Add columns
You can add a new column to your data by doing the following:
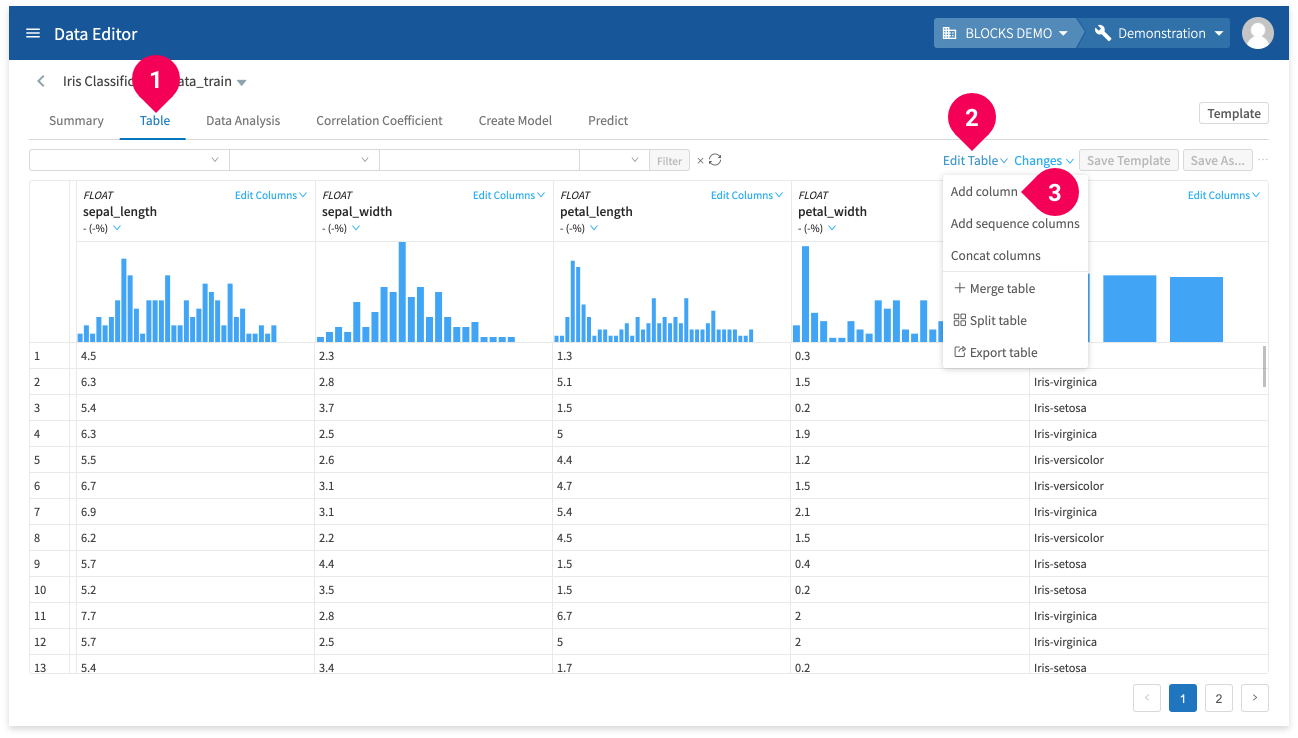
- Click Table.
- Click Edit Table.
- Click Add column.
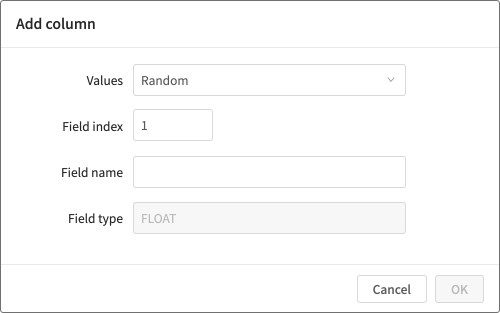
You can add columns containing the following types of data:
- Random values (FLOAT)
- Sequential values (INTEGER)
Add sequence columns
You can add sequence data columns by doing the following:
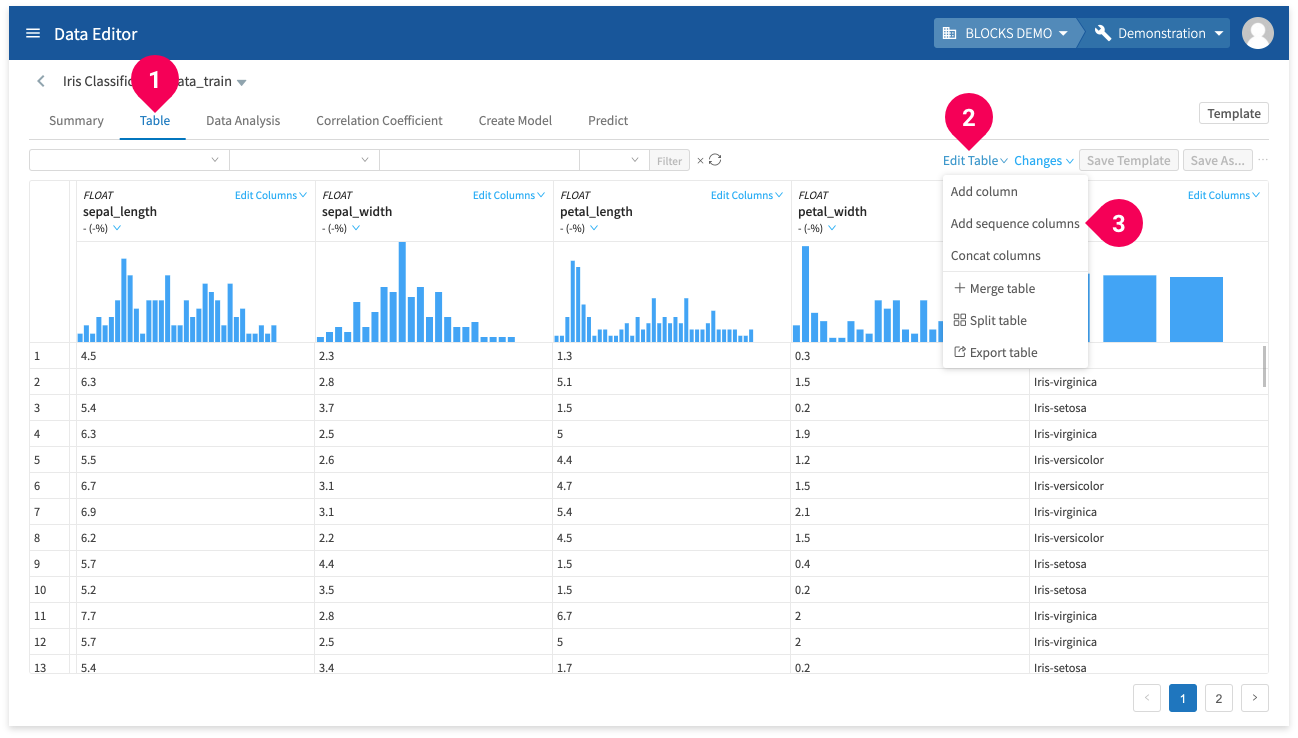
- Click Table.
- Click Edit Table.
- Click Add sequence columns.
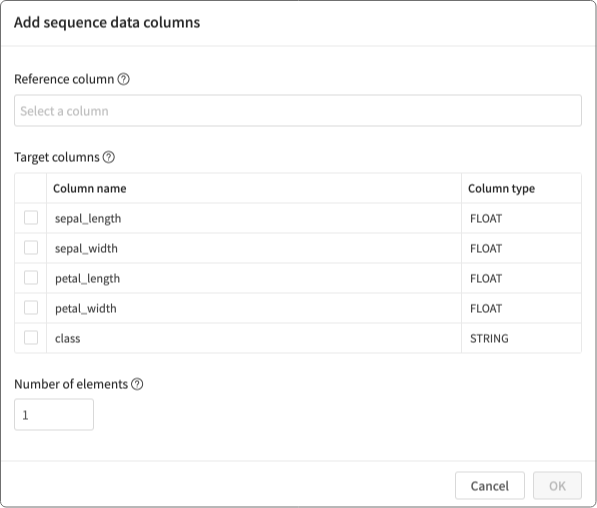
Configure settings for the sequence columns.
Concat columns
You can concat columns by doing the following:
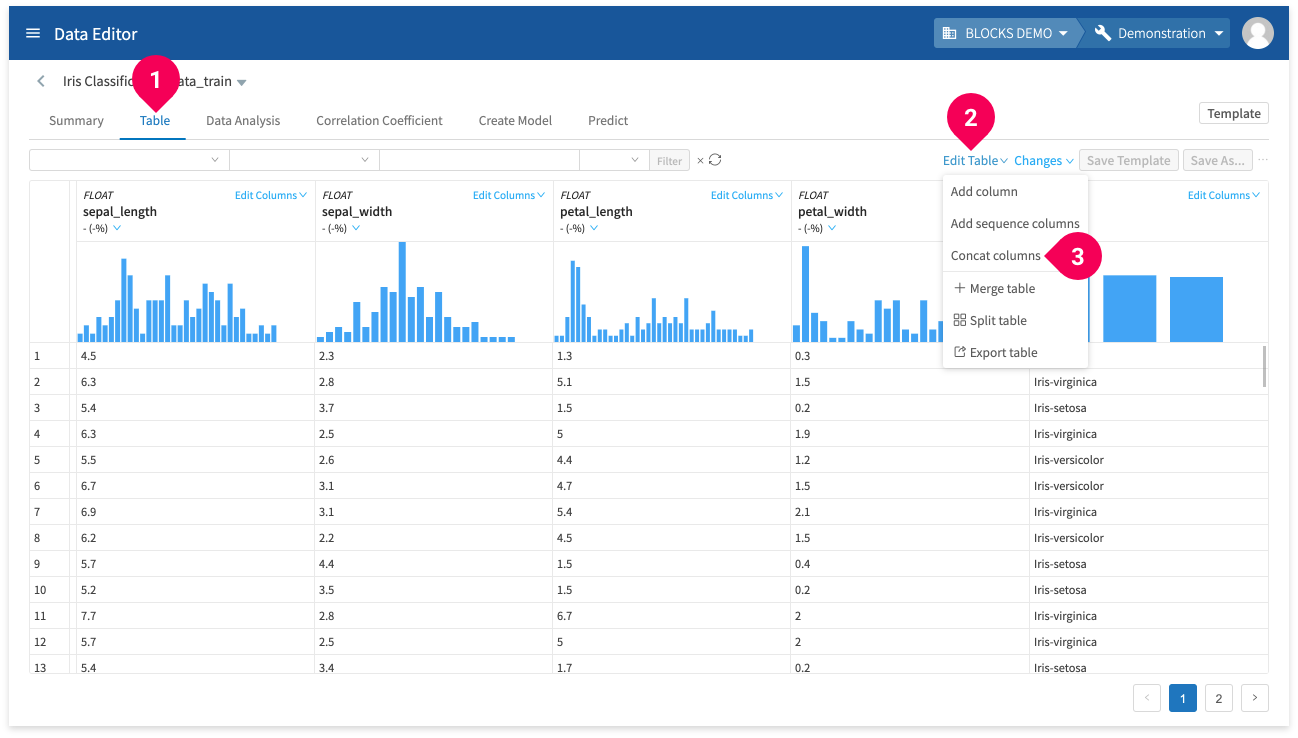
- Click Table.
- Click Edit Table.
- Click Concat columns.
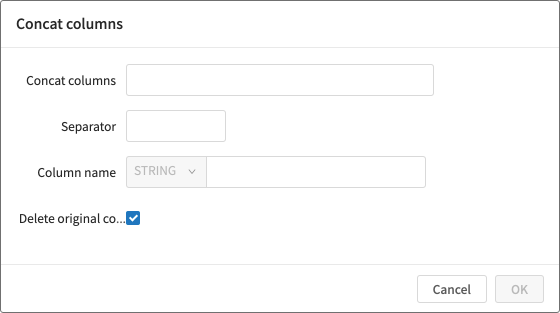
Configure settings for the columns that you will combine into one column.
Templates
You can save a series of edits as a template. Then, you can perform the same series of edits for new data in one step by simply selecting that template.
You can save up to 20 templates per project.
To save a template, do one of the following:
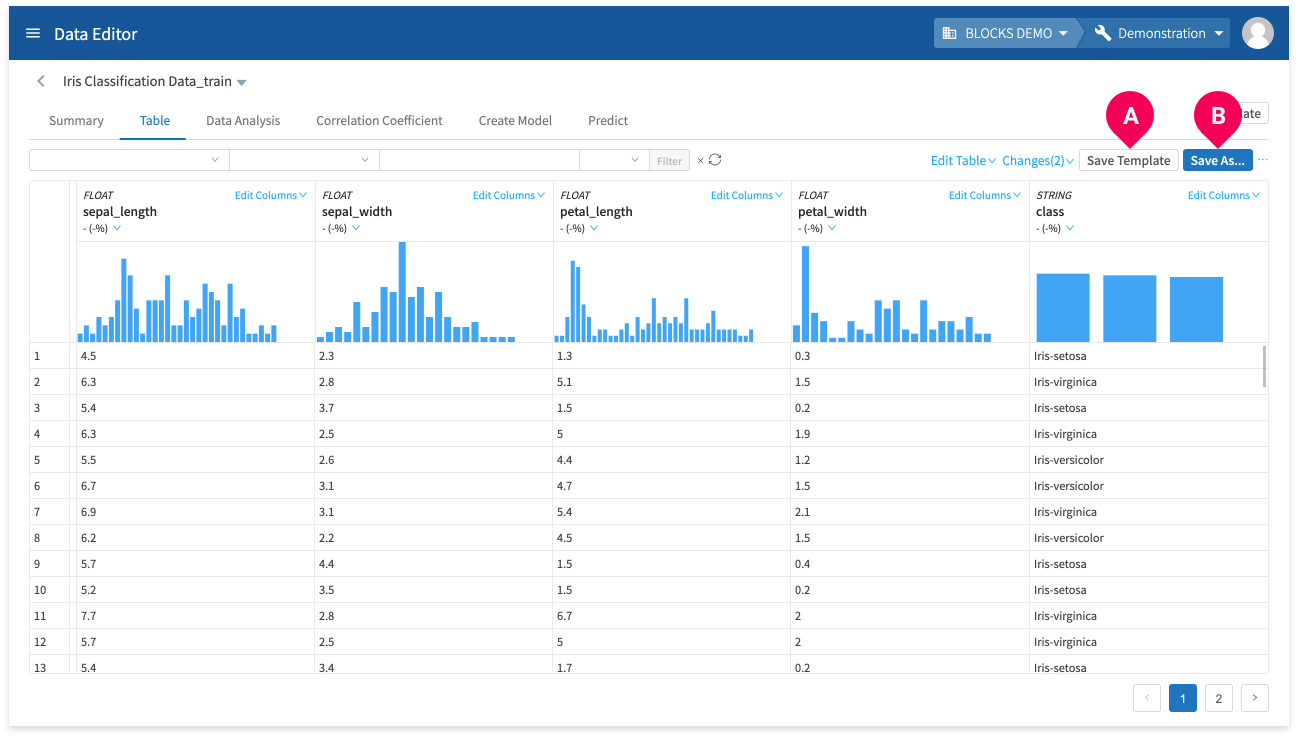
- A: Click Save Template.
- B: Click Save As... to save your data with a new name and your edits will be automatically saved as a template.
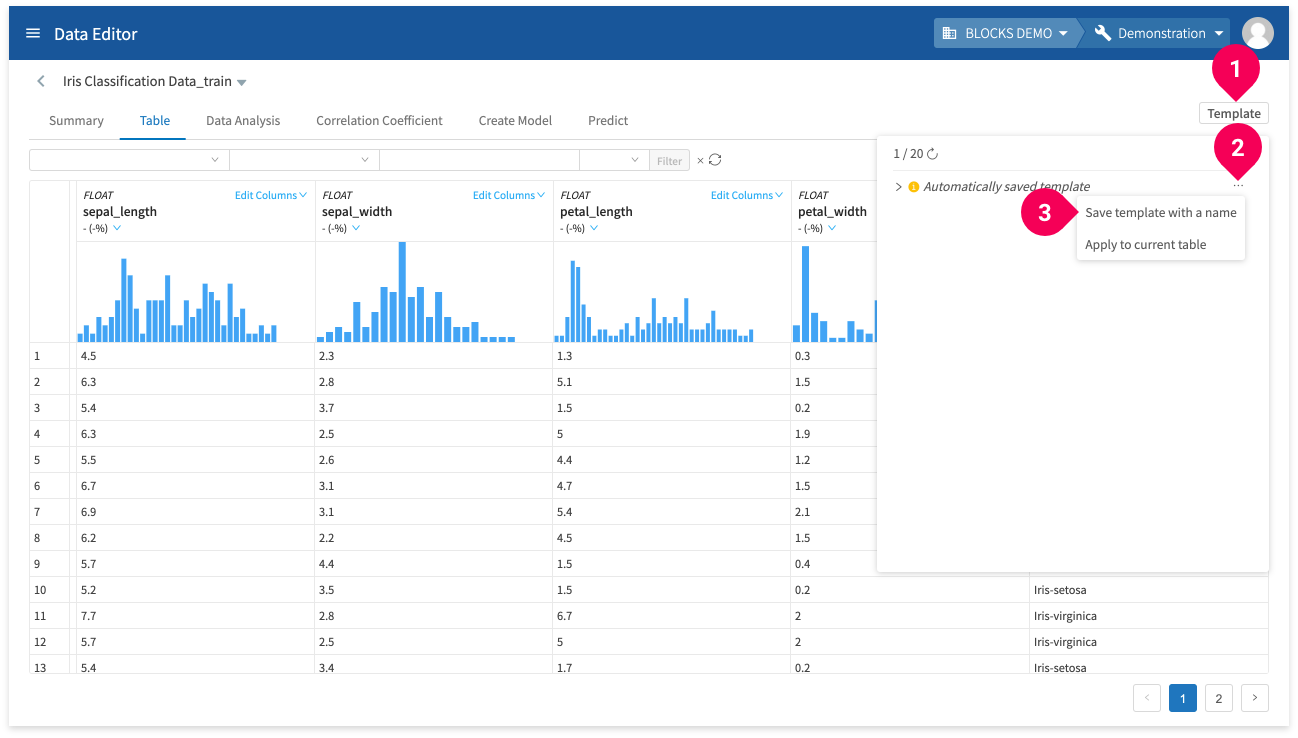
You must rename automatically saved templates in order to use them again. To do this, click Templates, then click Rename and save template.
Data analysis
The DataEditor includes various tools for aggregating and visualizing your data. With these tools, you can visually check the correlations between your data and better determine the value of each input feature. You can also use your aggregations in your training data.
The basic process for using the data analysis tools is as follows:
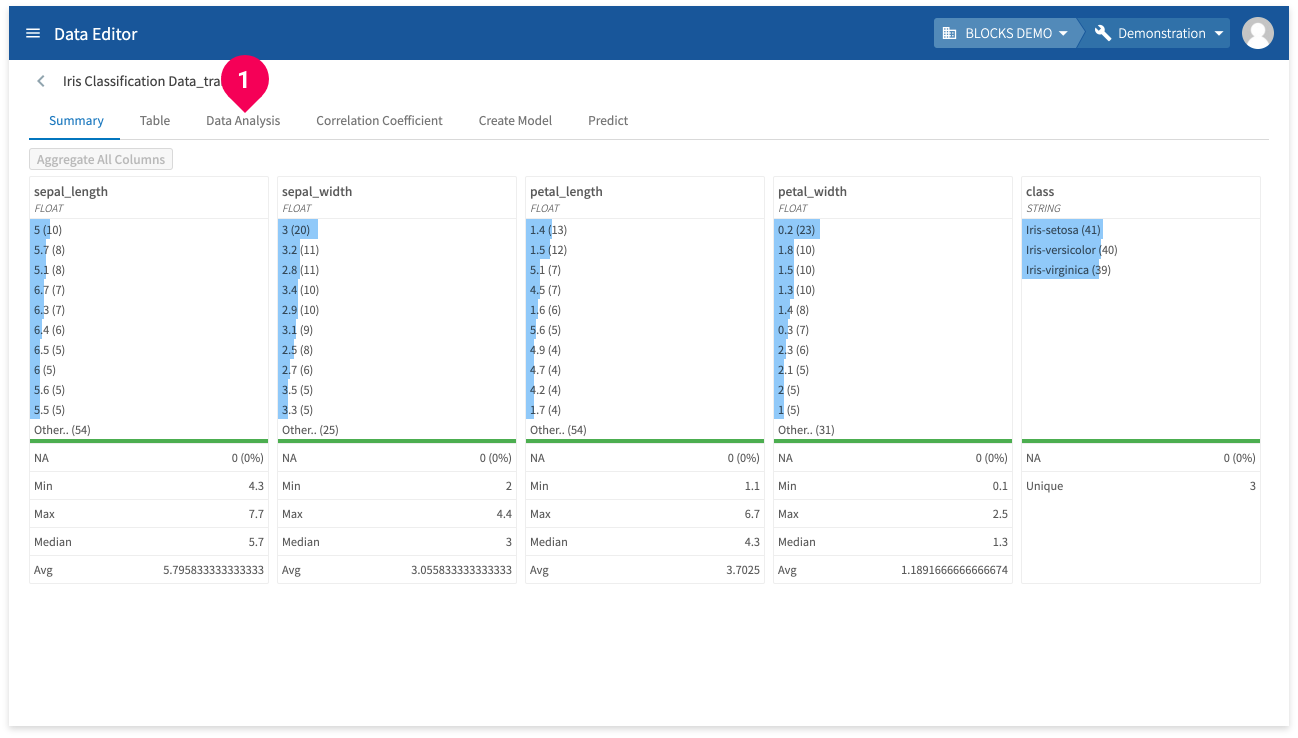
- Click Data Analysis.
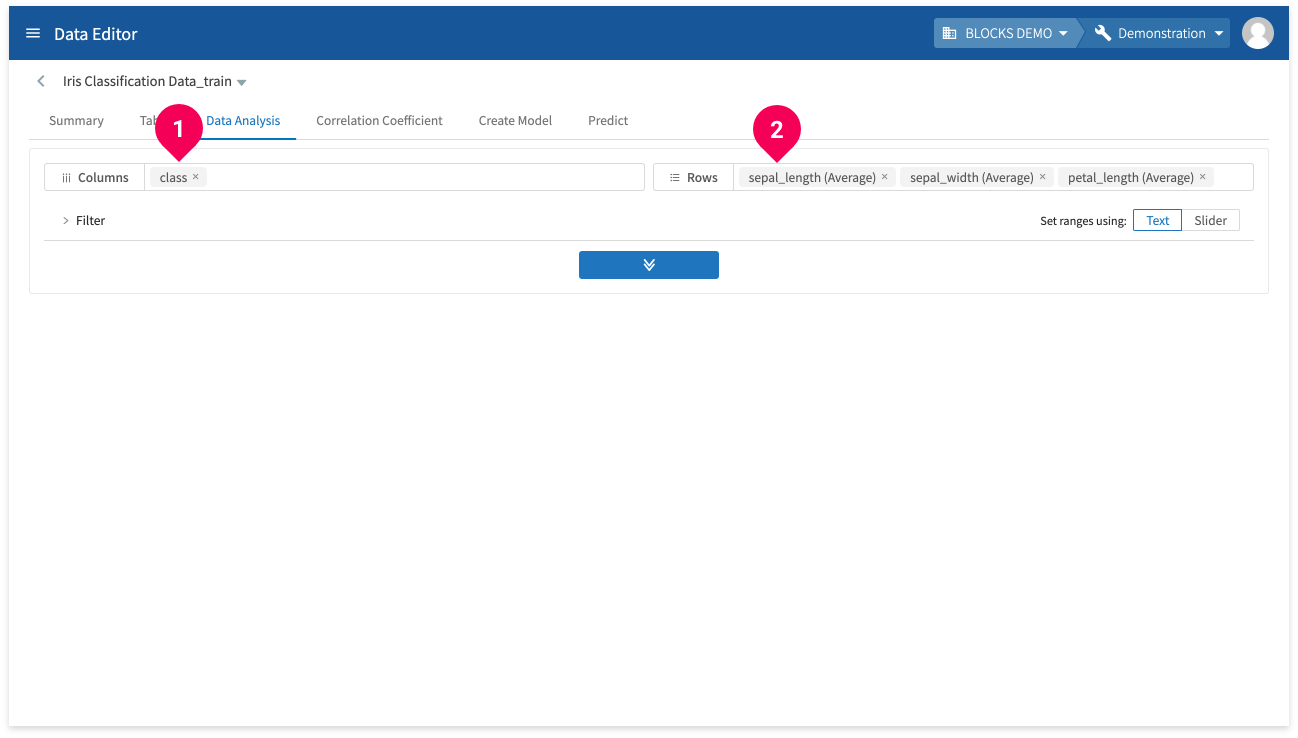
- Select the columns and rows to include in the analysis. Clicking the fields will bring up a selection menu.
info_outline When selecting columns, choices are displayed in groups as “dimensions” and “measures.” Dimensions are qualitative values, such as strings or days of the week, that could be used as classes or ways to partition the data. Measures are quantitative, numerical values that can be aggregated.
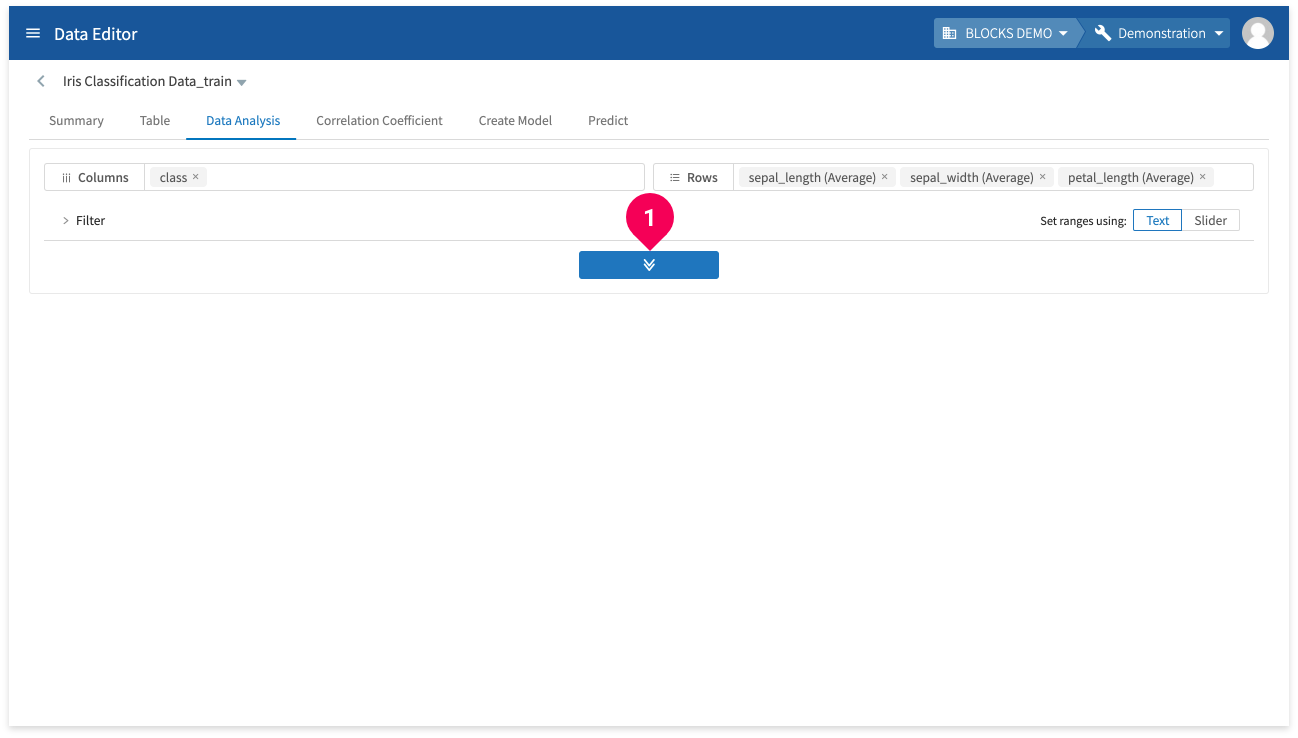
- Click the button in the center of the page and wait a bit for the results to be displayed.
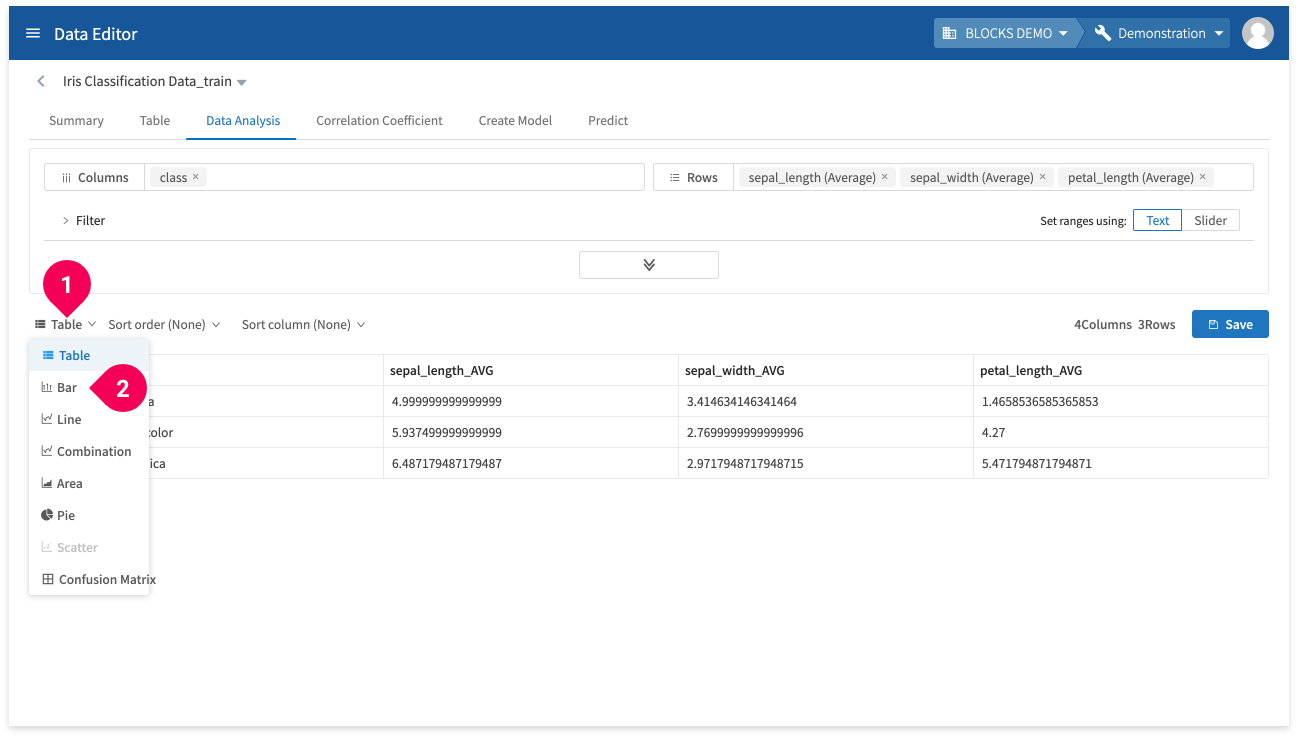
- Click Table to open a list of visualization options (table, bar graph, line graph, combination graph, area, pie, scatter, or confusion matrix). The following is an example of a bar graph.
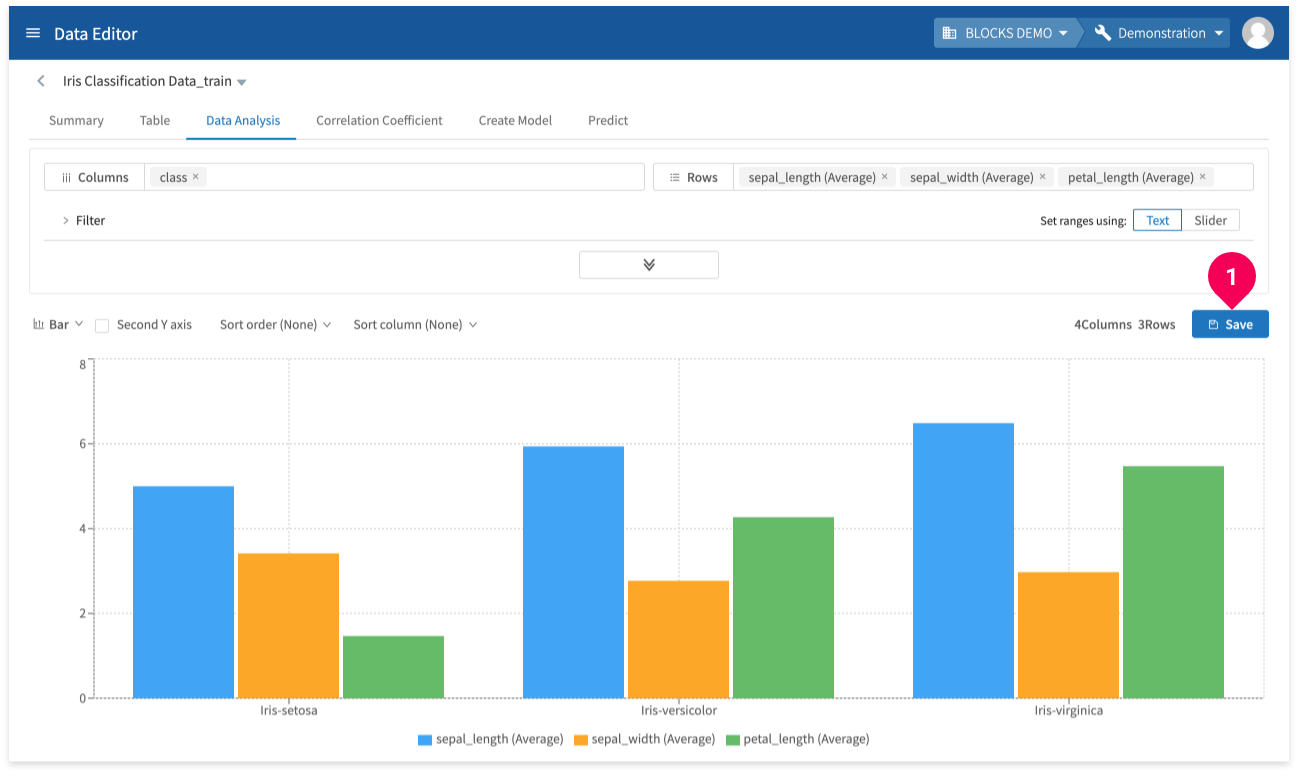
- Click Save to store your results into a BigQuery table.
Correlation coefficients
You can find correlation coefficients between selected columns with the DataEditor. With this, you can visually check the relationship between columns and better decide on the importance of each feature in your data.
Target columns for calculating correlation coefficients must be INTEGER, FLOAT, STRING, or BOOLEAN type. STRING-type columns will be handed as categorical (enum) data (for data showing numerical amounts, please convert the data into numerical data beforehand). BOOLEAN-type data is converted into numbers and finds the conversion factor.
info_outline Results for STRING-type columns are shown within the results with the format [column name]_[value in the enum list]. For example, if a column named a contained the values "foo", "bar", and "baz", the results would be shown as a_foo, a_bar, and a_baz. The value portion of the results will only contain alphanumeric characters, and any non-alphanumeric characters will be discarded. If there are no usable characters or if the results would be a duplicate, a serial number will be assigned instead.
To find correlation coefficients, do the following:
- Click Correlation Coefficient.
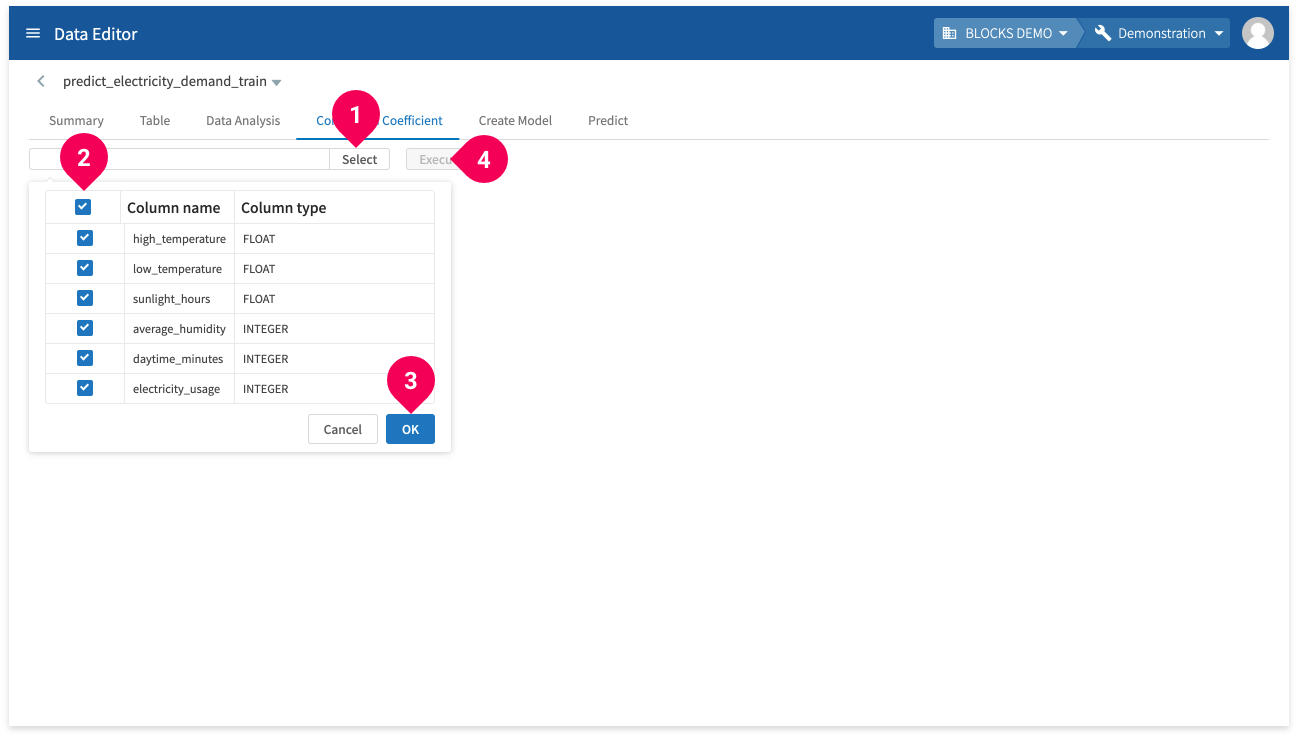
- Click Select.
- Select the columns that you want to find correlation coefficients for.
- Click OK.
- Click Execute.
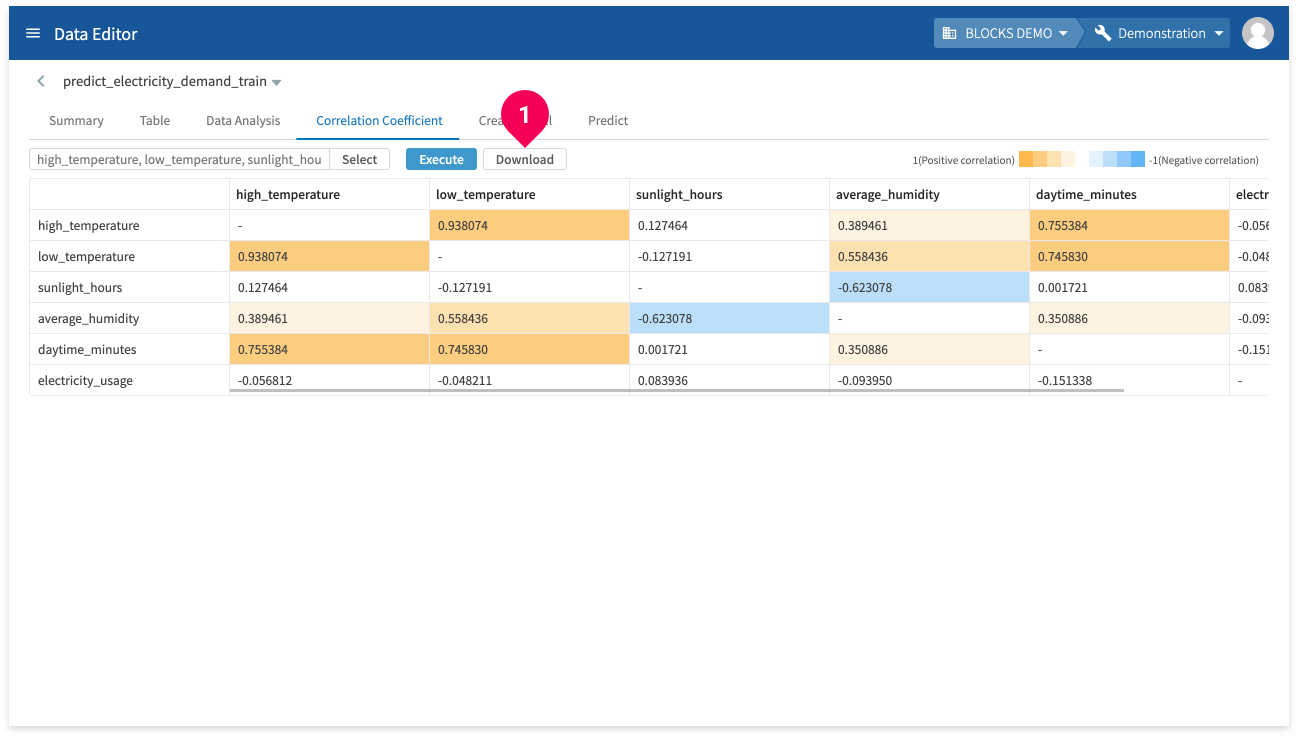
The results are shown visually with colors according to the correlation coefficient values.
You can click Download to download a CSV file of the chart of results.
- - values in the chart will be converted into 1 values in the CSV file.
- The values shown on the screen are rounded to six decimal places, but downloaded data is not rounded.
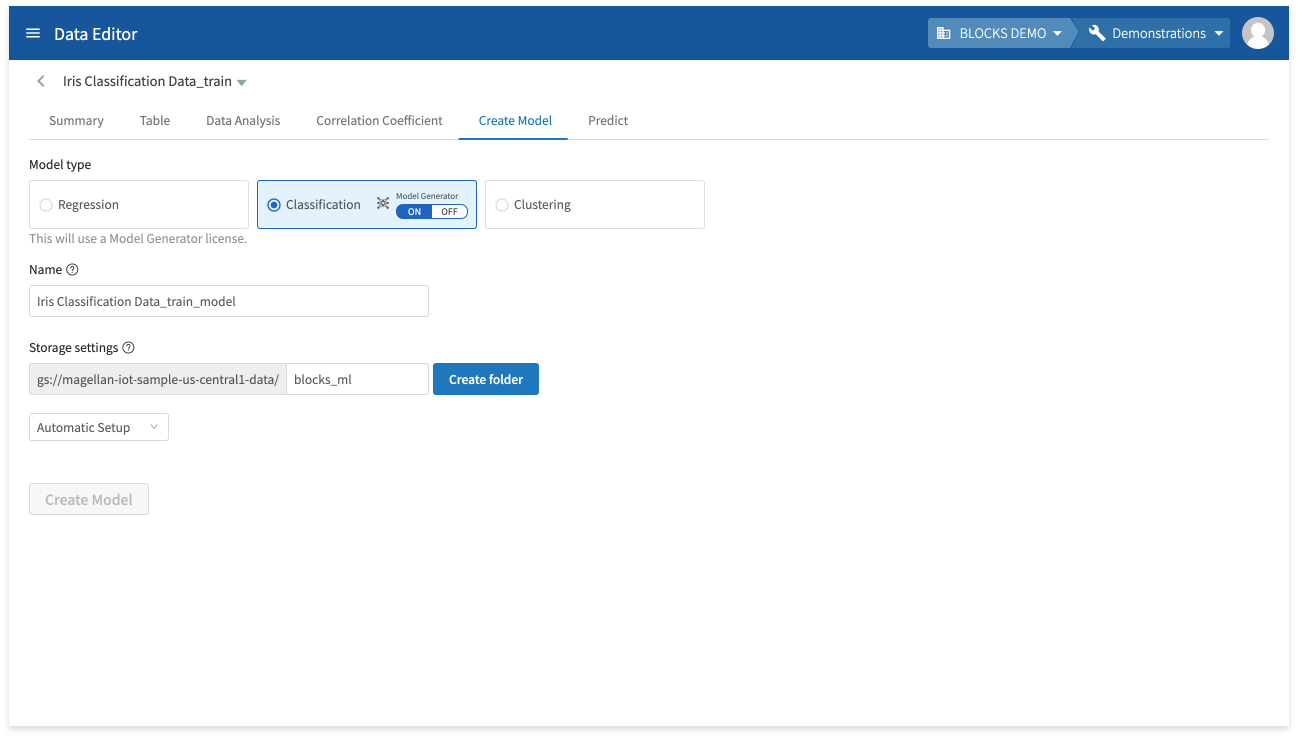
Create models
You can create the following types of models from the DataEditor:
- Regression
- Classification
- Clustering
Additionally, you can select whether to create the following two types of models by using a Model Generator or not:
- Regression
- Classification
You can create models from the Create Model tab.
For more information about creating models in the DataEditor, refer to Creating models and making predictions in the DataEditor.
Make predictions
You can use models created in the DataEditor or from a Model Generator (classification/regression) to make predictions.
info_outline You can use the Flow Designer to run batch predictions or to automate a schedule for predictions. For more details about using the Flow Designer for predictions, refer to Using Flow Templates or the classification and regression model tutorials (Classification prediction/Regression preditcion).
To make predictions from the DataEditor, open the editor page for prediction data and do the following:
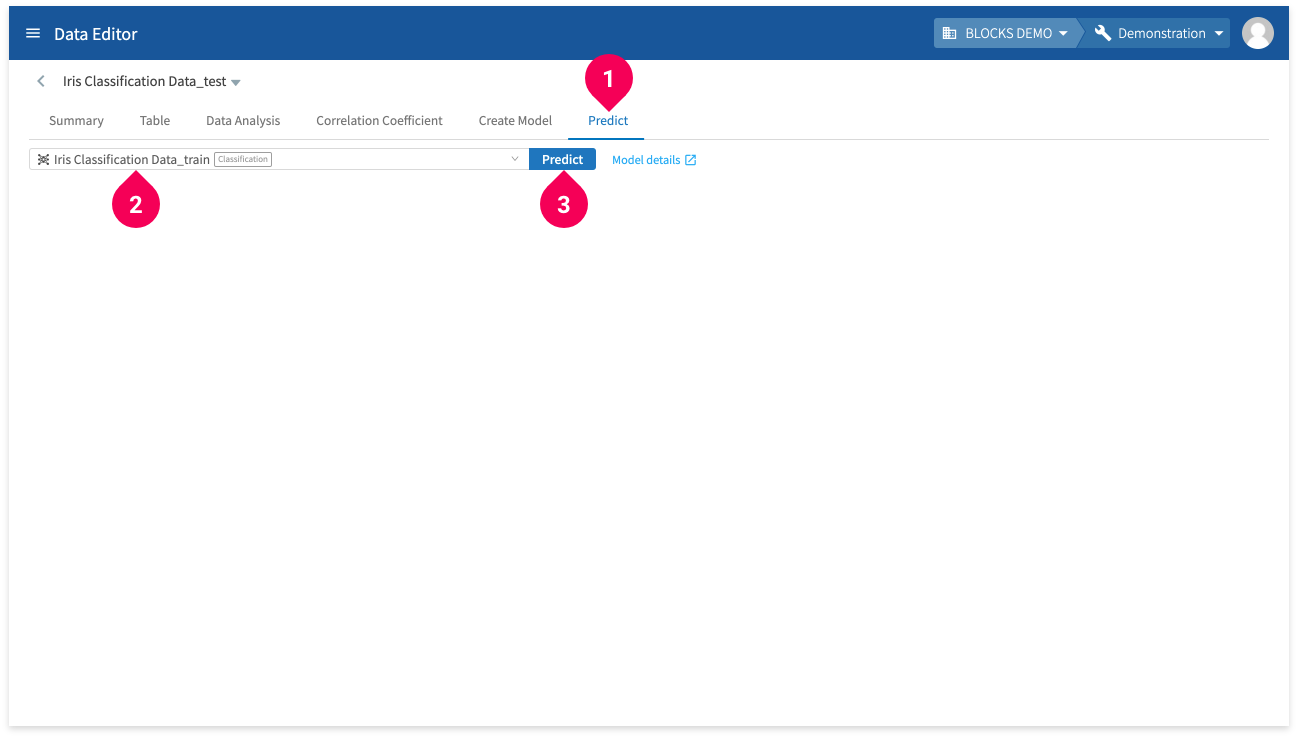
- Click Predict.
- Select the model to use for making predictions.
- Click Predict.
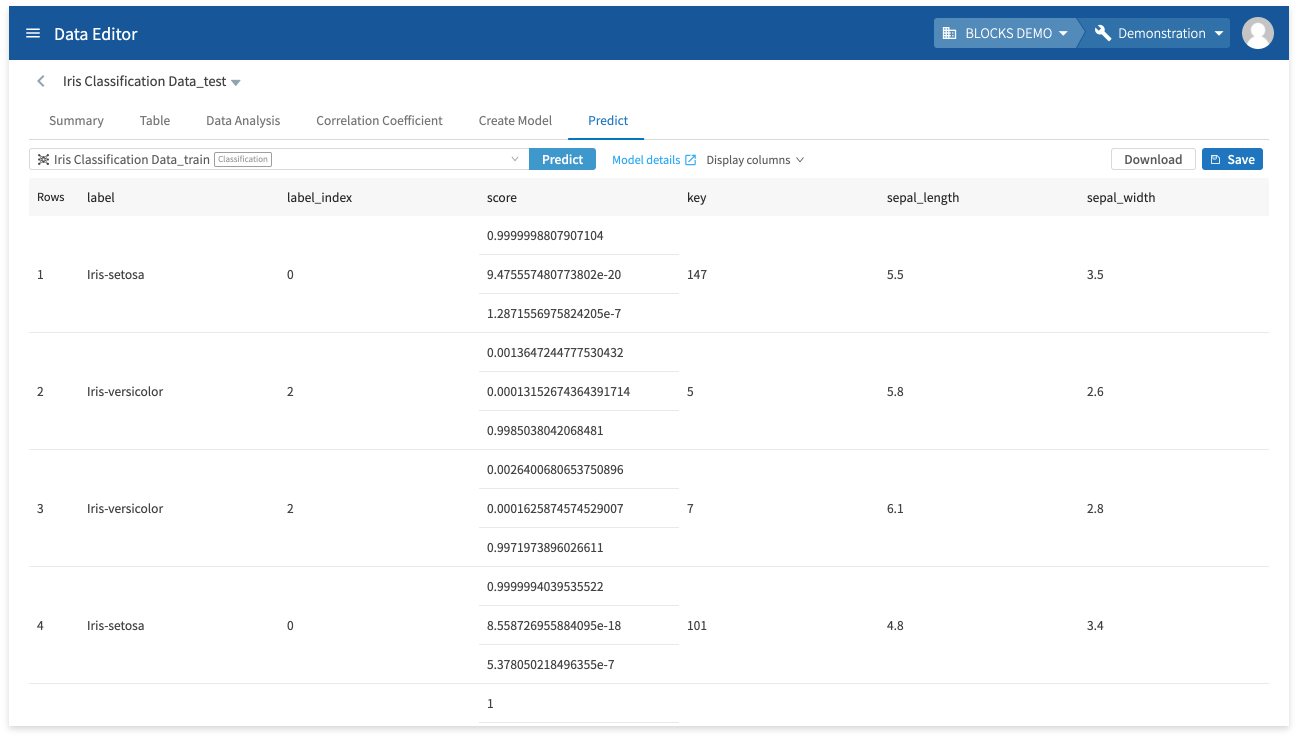
The results will be displayed after a bit of time. The formatting of the results depends on the type of model used. For more information, refer to Creating models and making predictions in the DataEditor.
Merging tables
You can merge (join) data from your tables with other tables you’ve stored in the DataEditor or weather data from Japanese Meteorological Agency (JMA) observatories.
For the weather data, you can use data for one observatory by day or by hour. To join weather data, the base data must have a column for the date (DATE, DATETIME, or TIMESTAMP). If using a DATE format only, you can only join daily weather data.
error You must purchase a license to use the JMA weather data. This license is separate from licenses to use the DataEditor.
You can merge tables from the data list by doing the following:
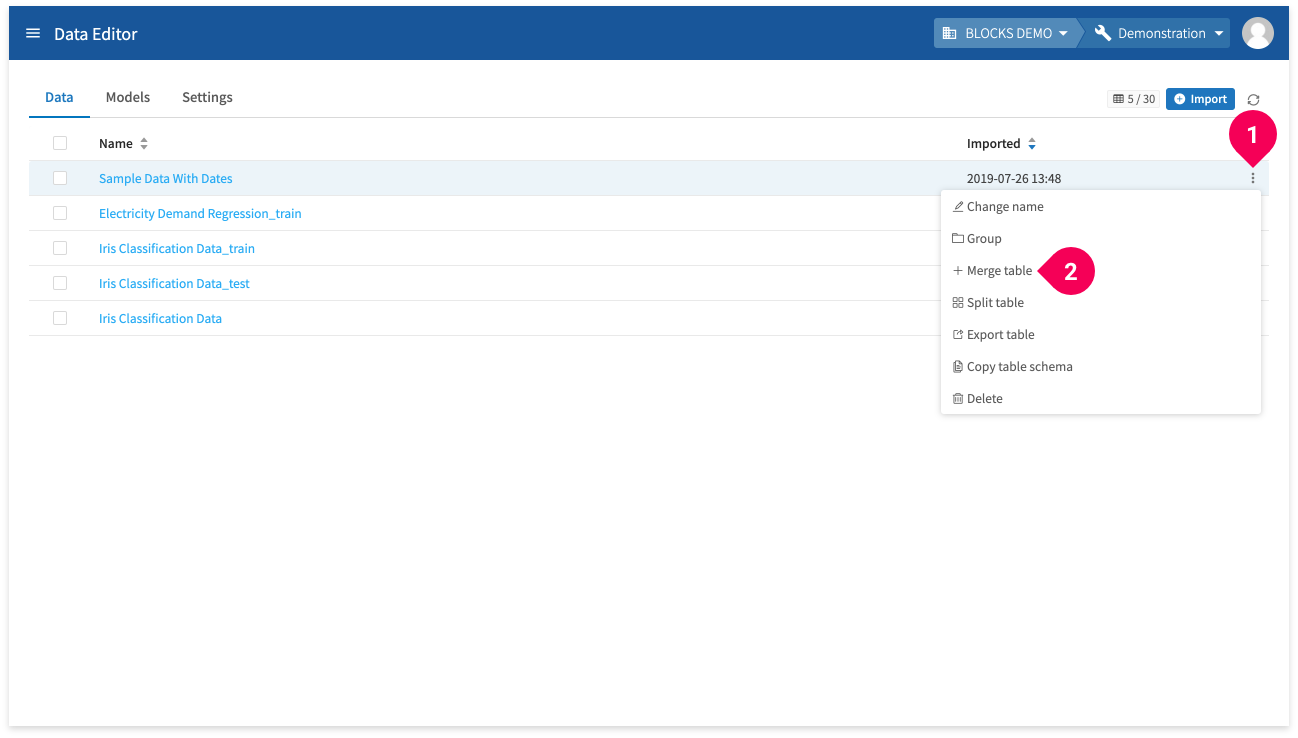
- Click more_vert for an item in the data list.
- Click Merge table.
You can also merge tables from the editor screen by doing the following:
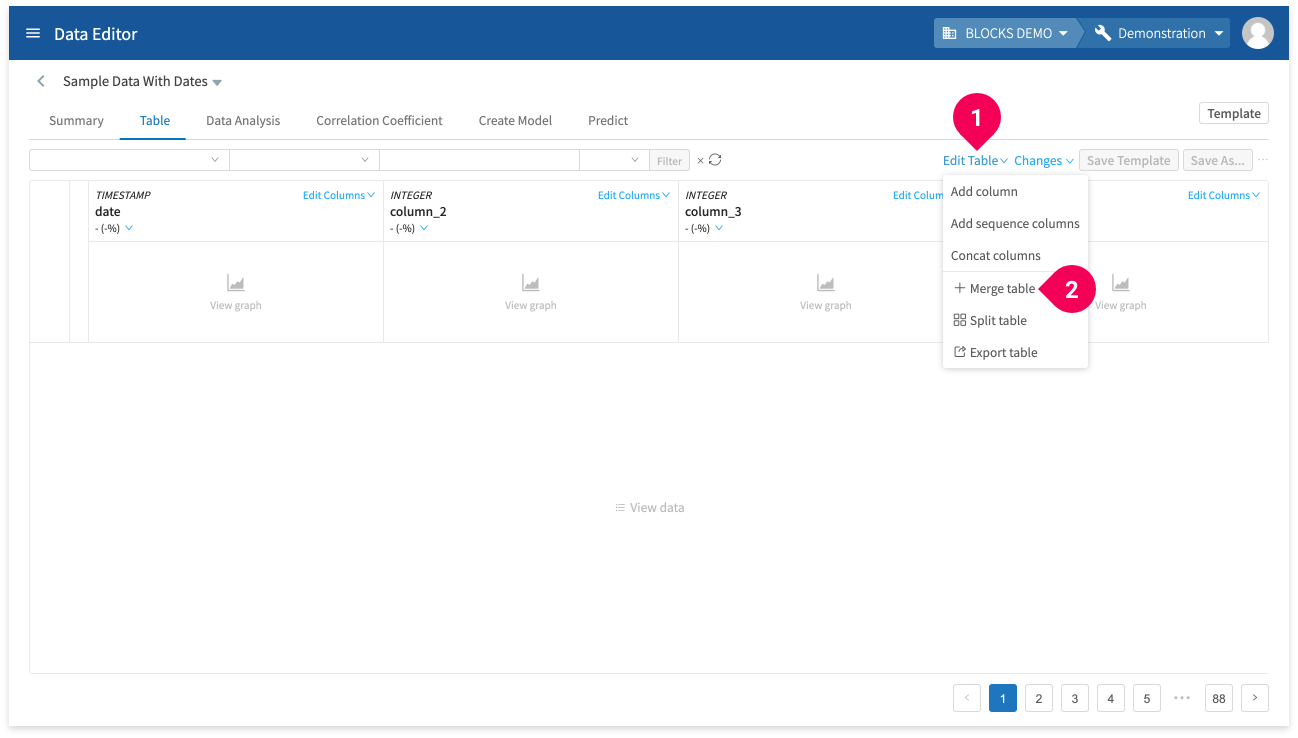
- Click Edit Table.
- Click Merge table.
To merge a table with other data stored in the DataEditor, do the following:
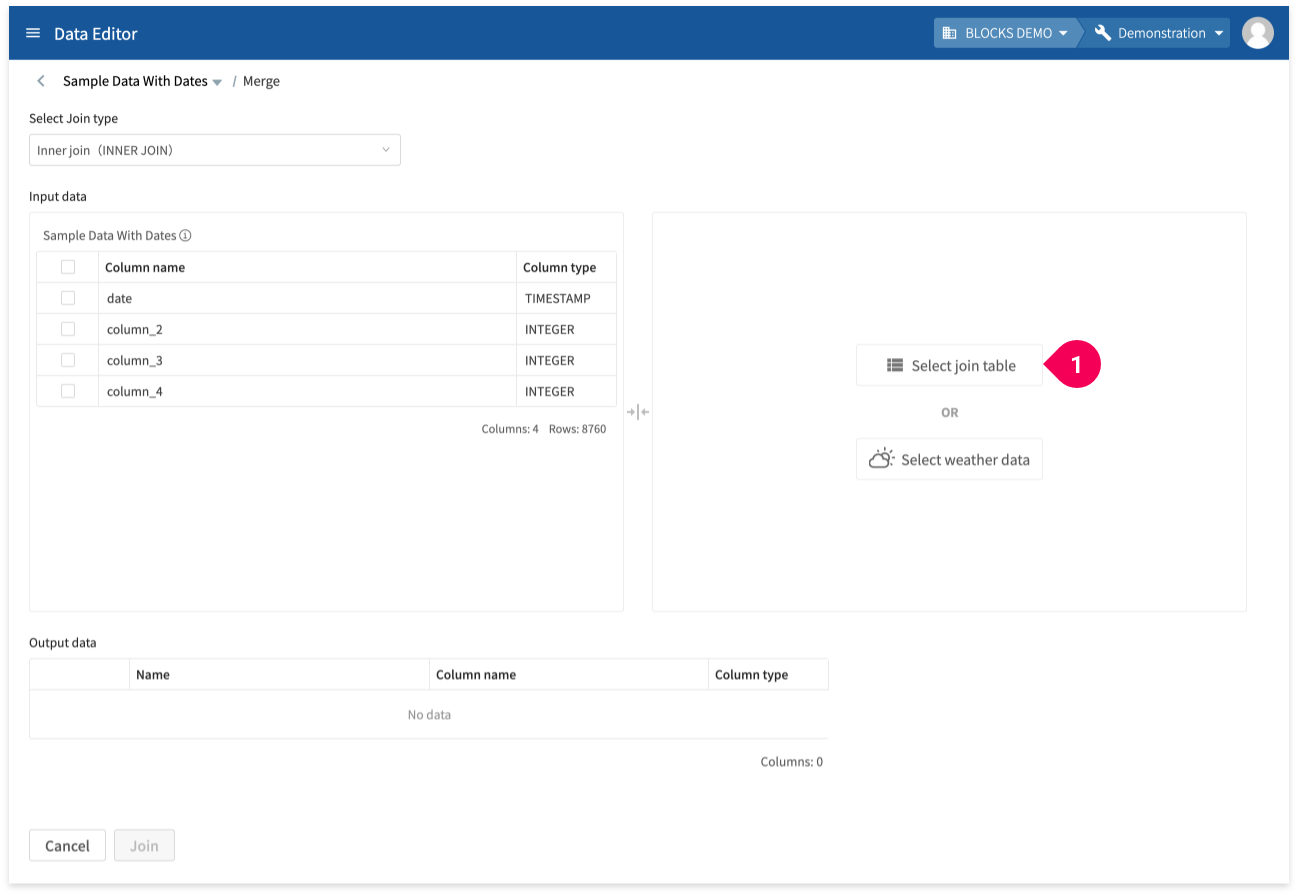
- Click Select join table.
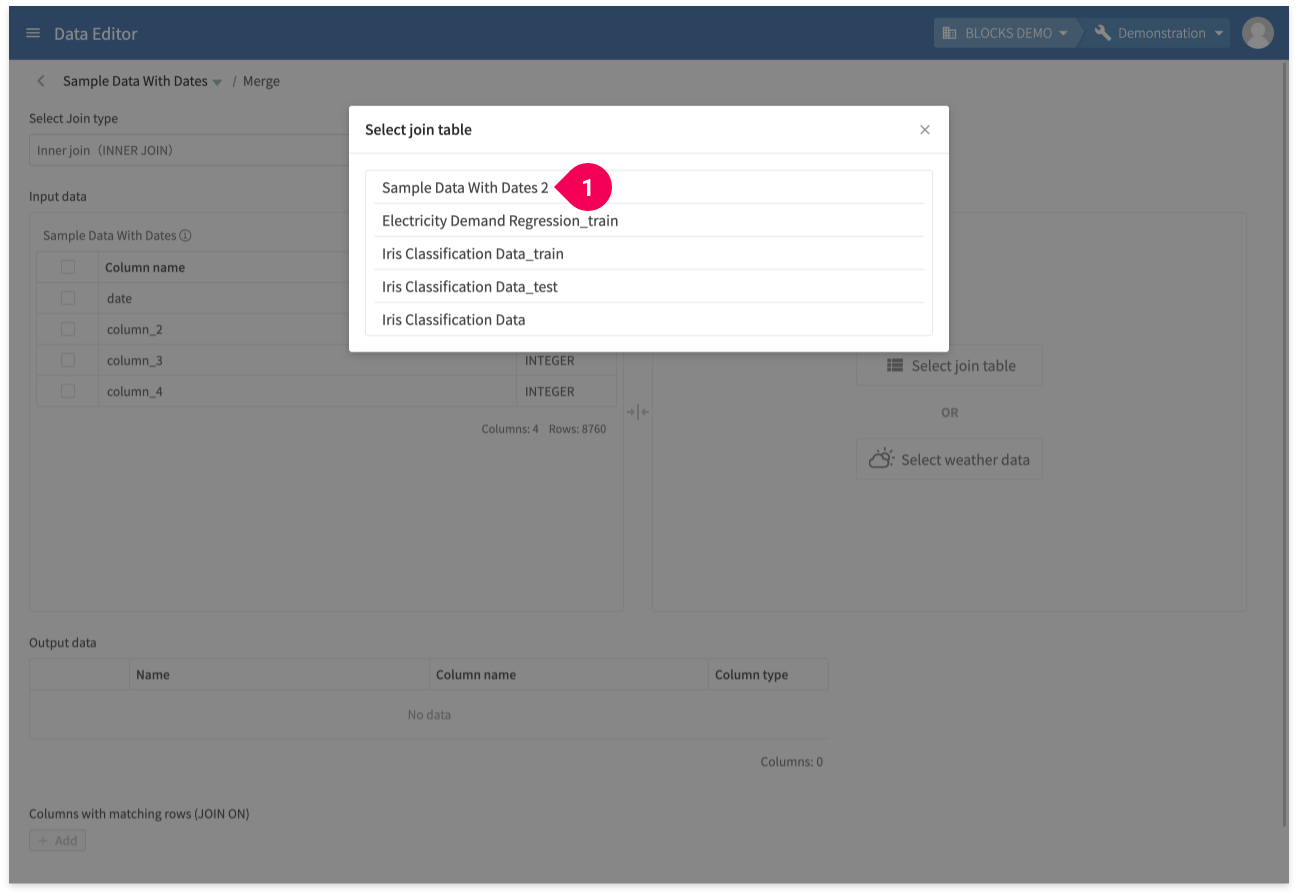
- Click the data to join with the original table.
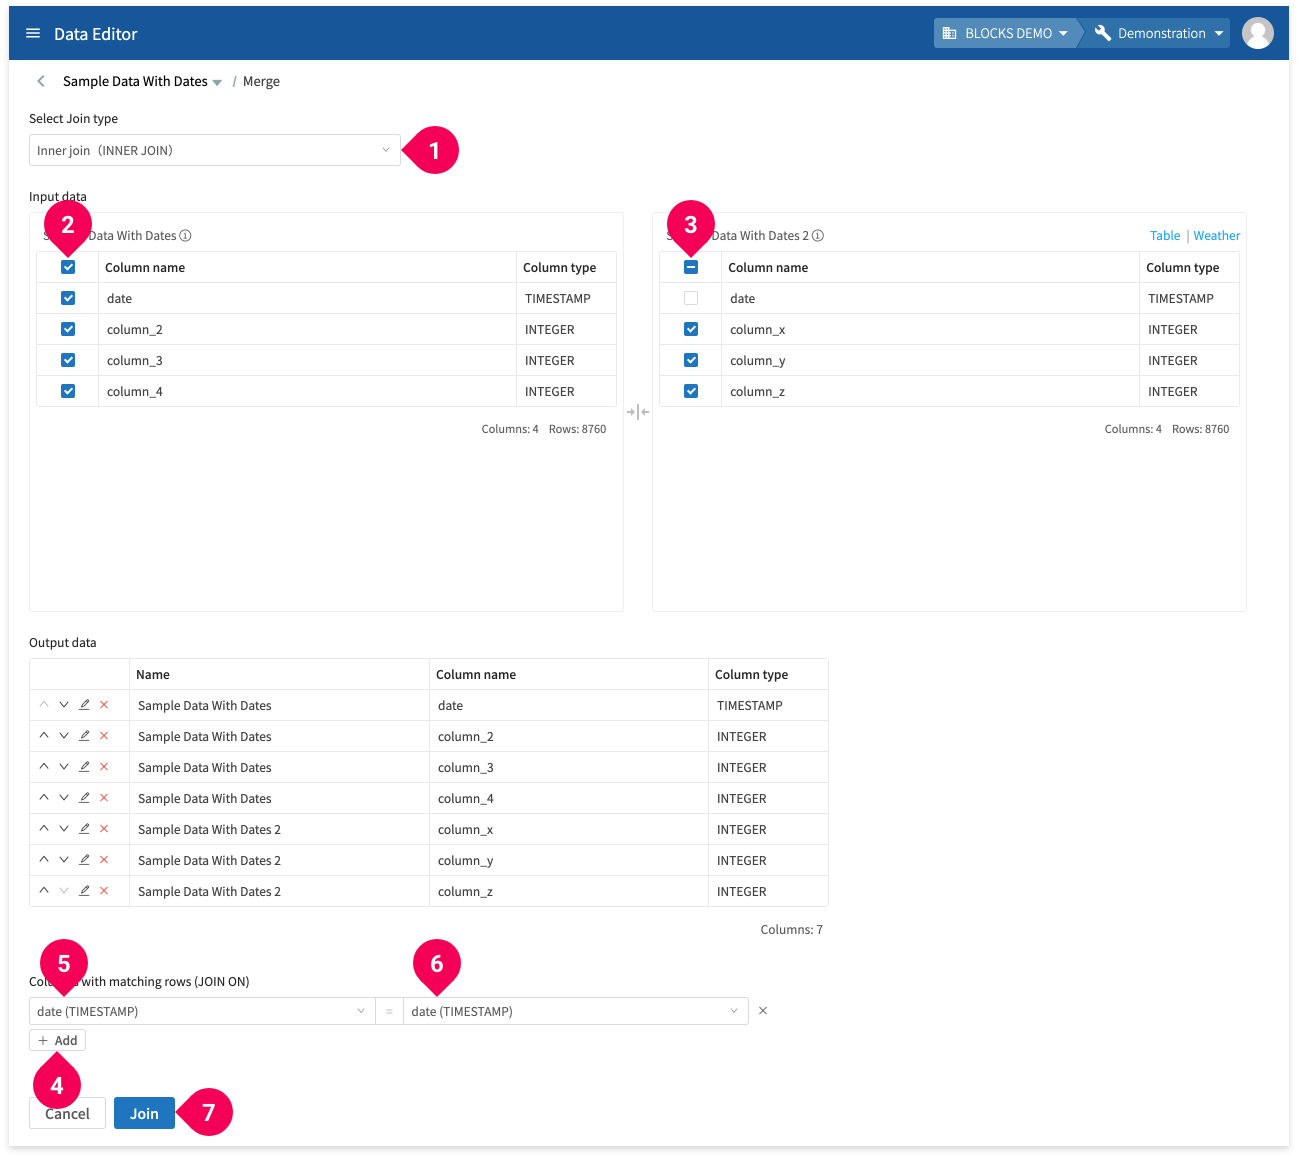
- Select the join type. The example above shows an Inner Join.
- Select which columns to include from the original table.
- Select which columns to include from the second table.
- Click Add.
- Select the shared column for table 1.
- Select the shared column for table 2.
- Click Join.
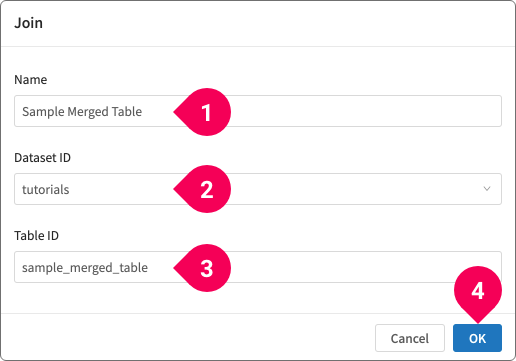
- Enter a name for the resulting data.
- Click the dataset ID.
- Enter a table ID.
- Click OK.

- Click OK and the merged data will appear in the data list after a bit of time.
To merge with the JMA weather data, do the following:
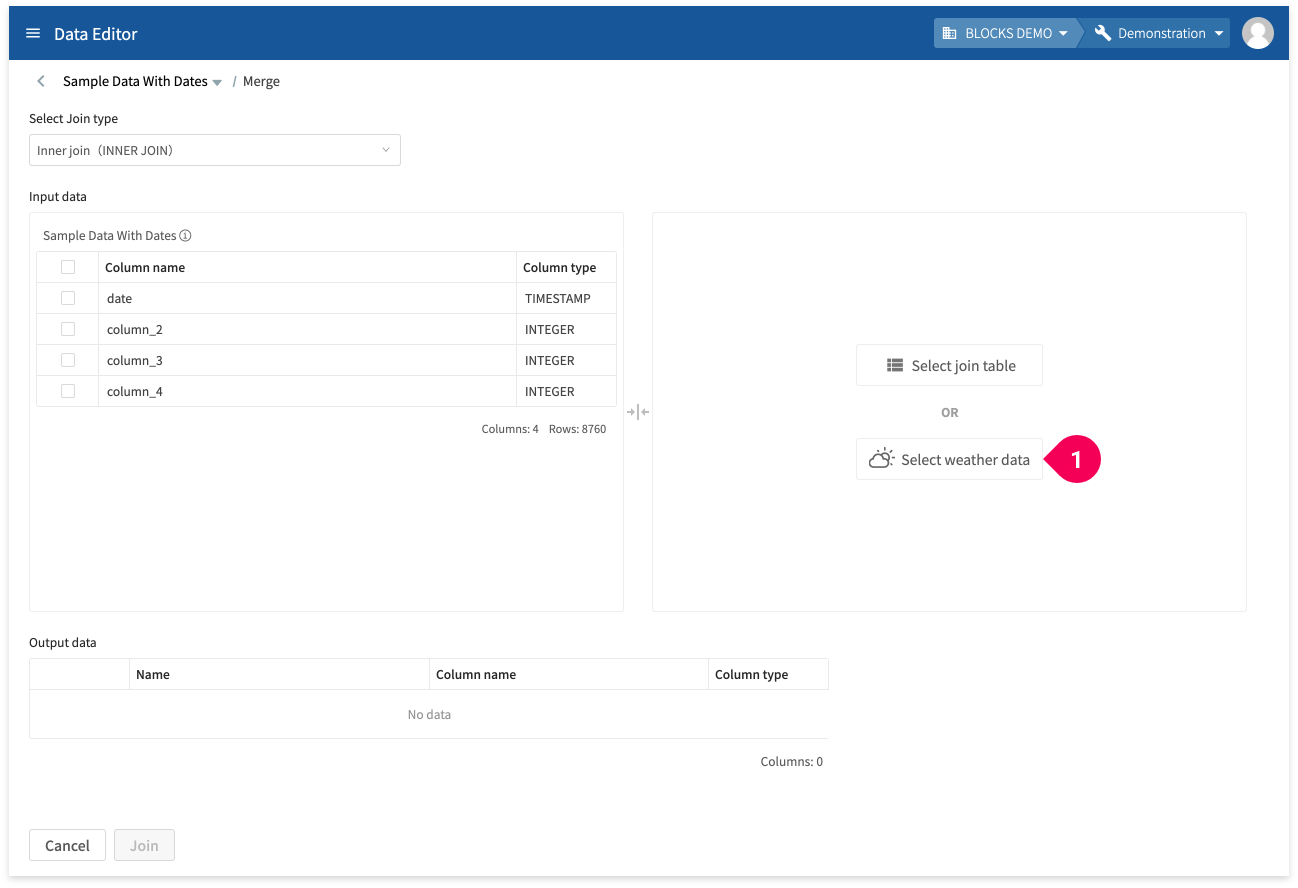
- Click Select weather data.
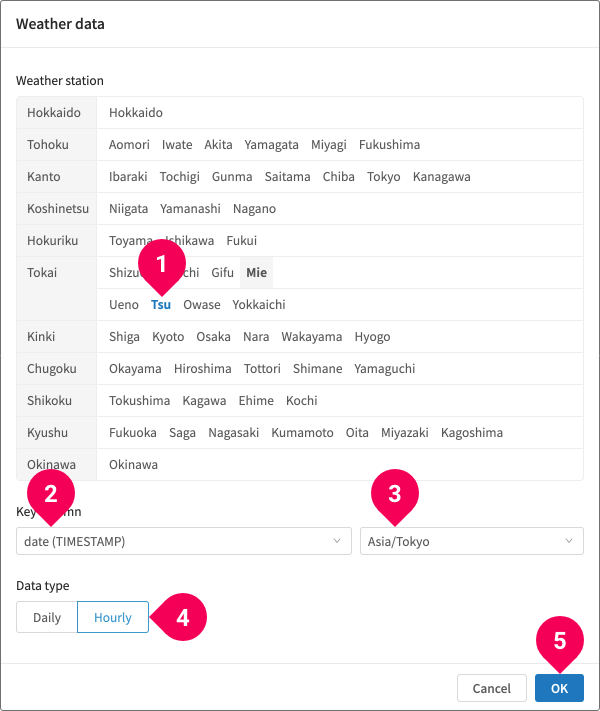
- Select one weather observatory
- Select the column from the original data that contains date information.
- Select the time zone.
- Select either Daily or Hourly data.
- Click OK.
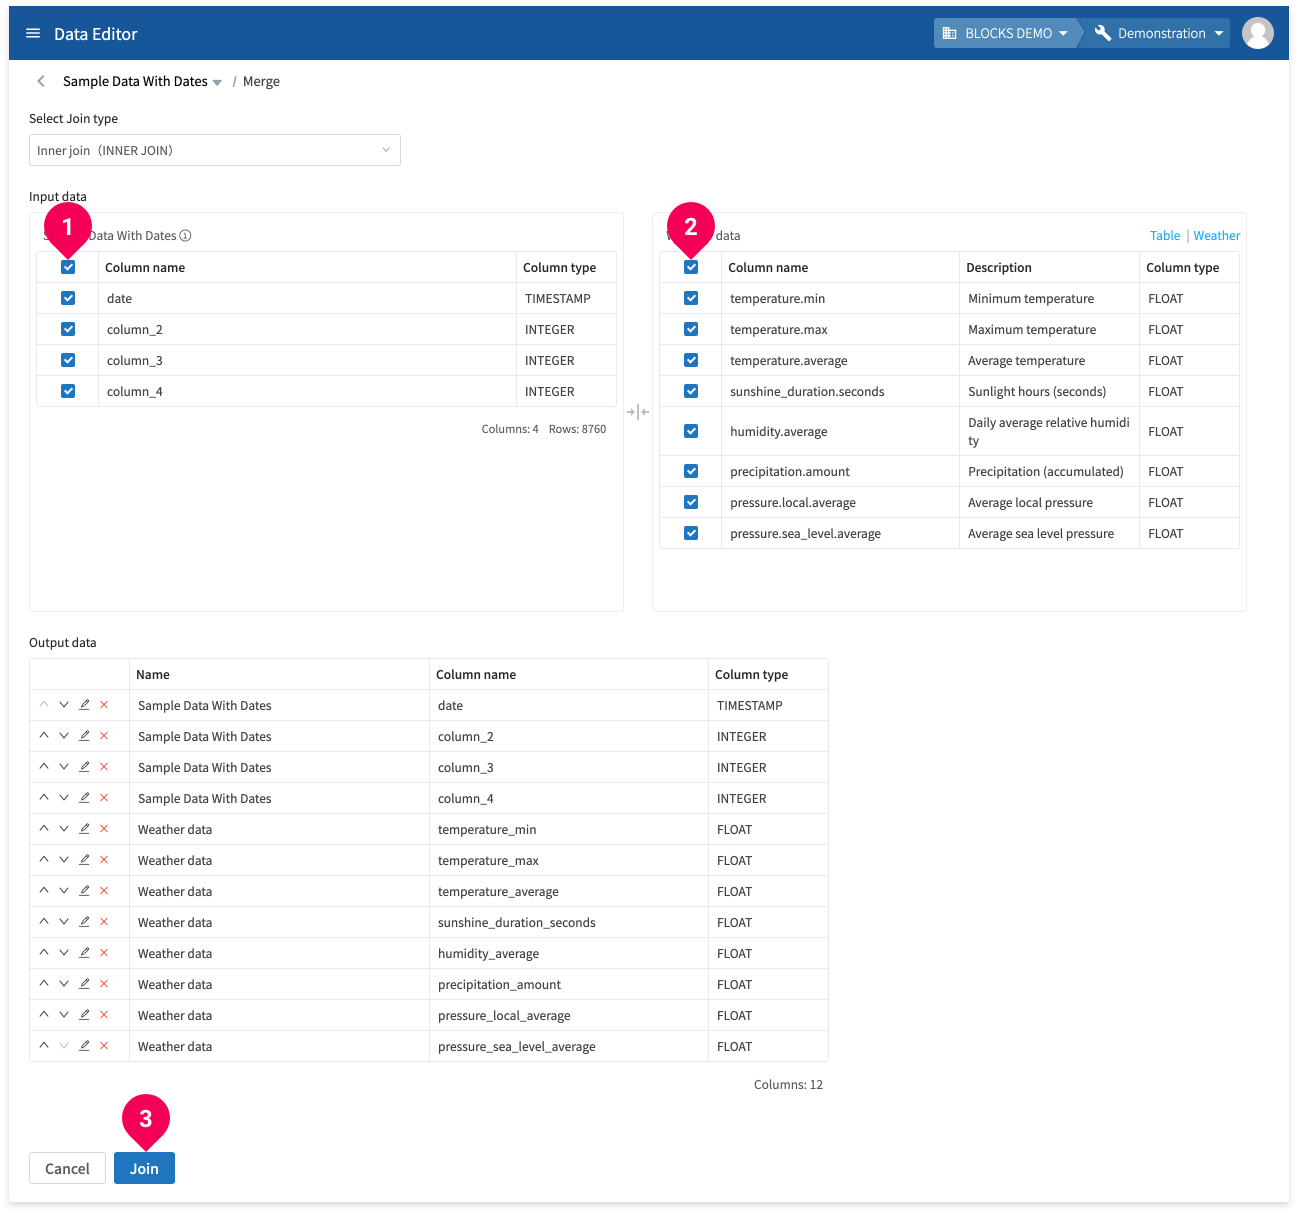
- Check the columns from the original table to merge.
- Check the columns from the weather data to merge.
- Click Join.
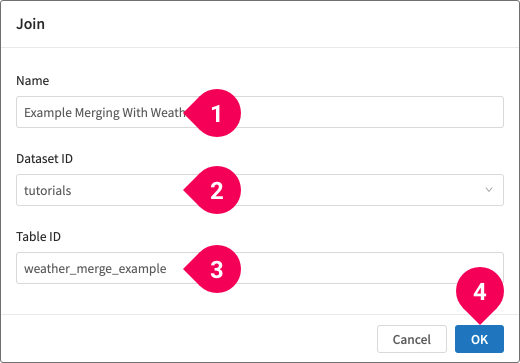
- Enter a name for the resulting data.
- Click the dataset ID.
- Enter a table ID.
- Click OK.
- Click OK and the merged data will appear in the data list after a bit of time.
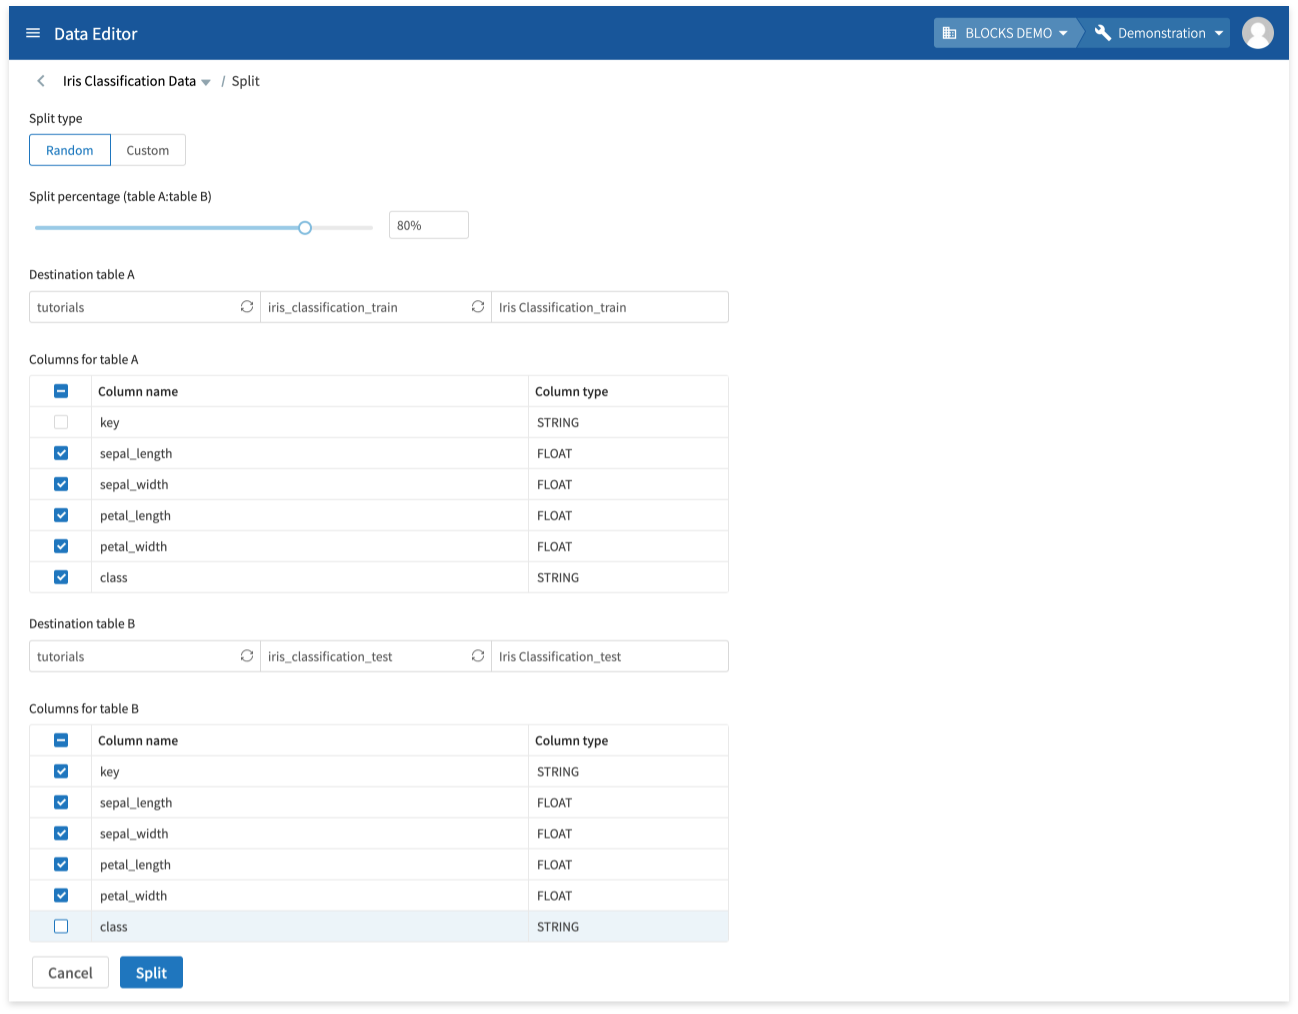
Splitting tables
You can split a table into two tables. You can either split the data randomly according to a set ratio, or you can configure custom conditions.
You can access split tables from the data list by doing the following:
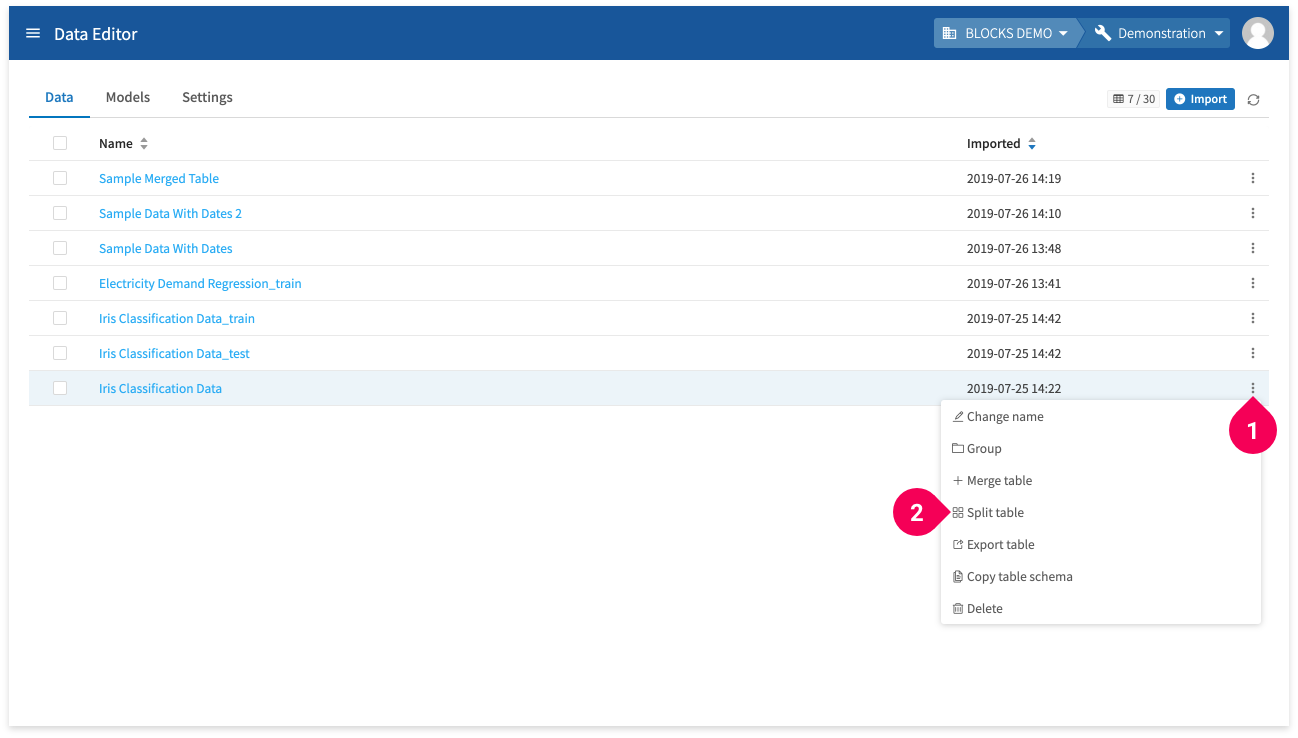
- Click more_vert for an item in the data list.
- Click Split table.
You can also access split tables from the editor by doing the following:
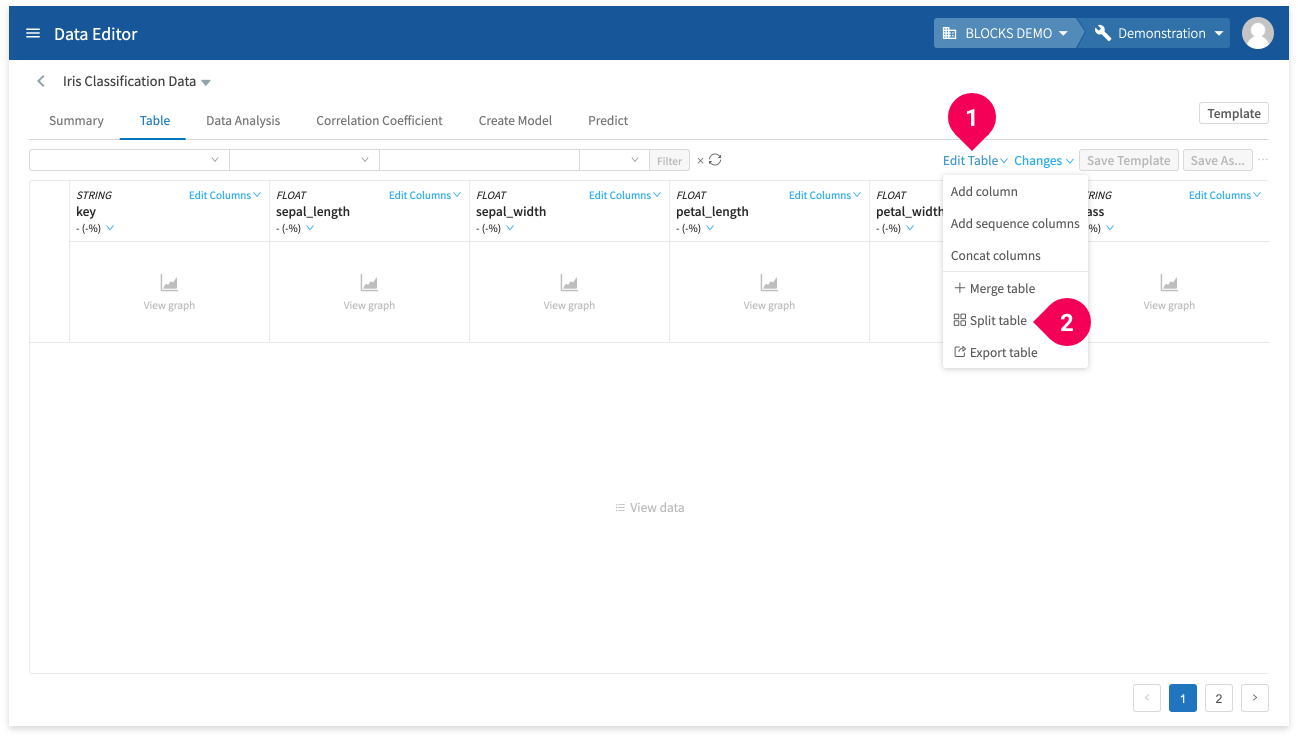
- Click Edit Table.
- Click Split table.
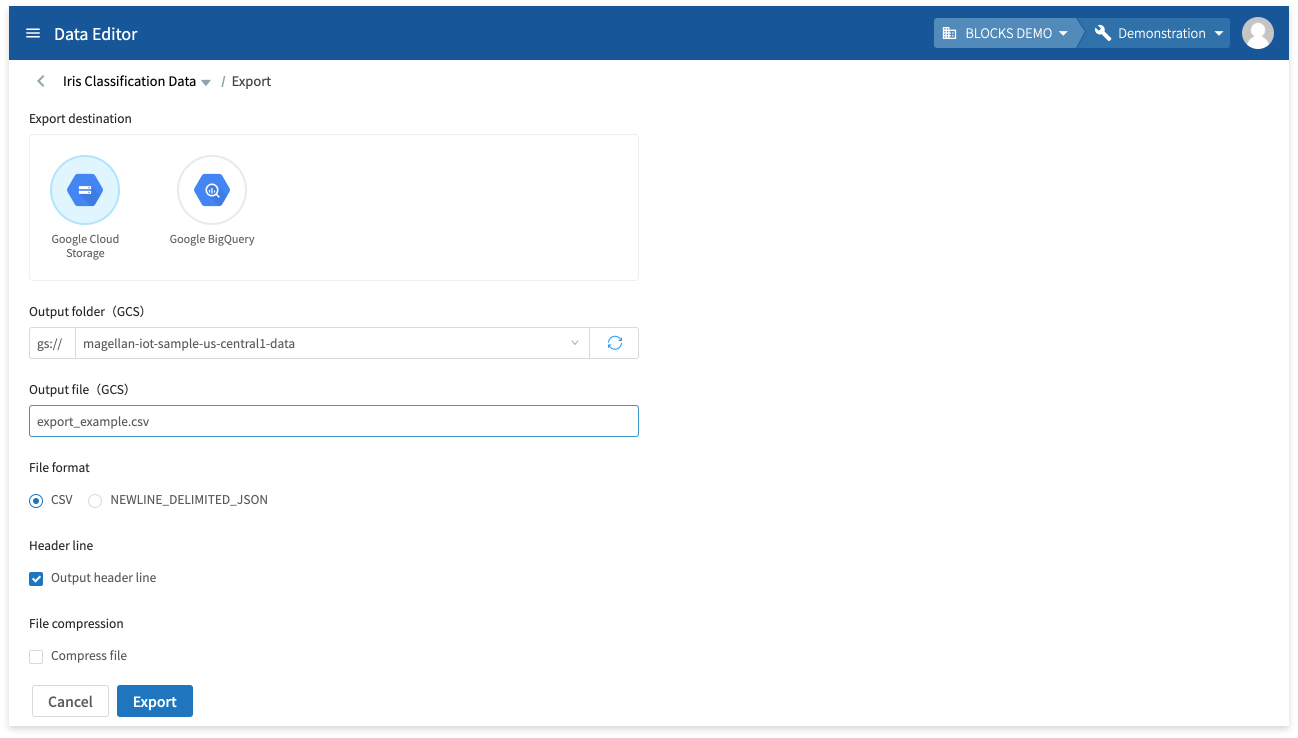
Exporting
You can export the contents of your data to GCS as a CSV or JSON format text file, or as a BigQuery table.
When exporting to GCS, a download link for the file will appear as shown below:
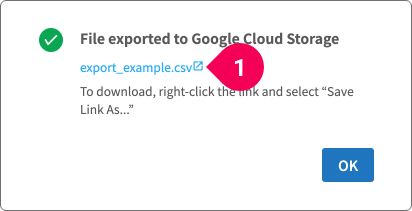
- Right-click the link and select Save link as... to download the file to your PC.
You can export data from the data list by doing the following:

- Click more_vert for an item in the data list.
- Click Export table.
You can export data from the editor by doing the following:
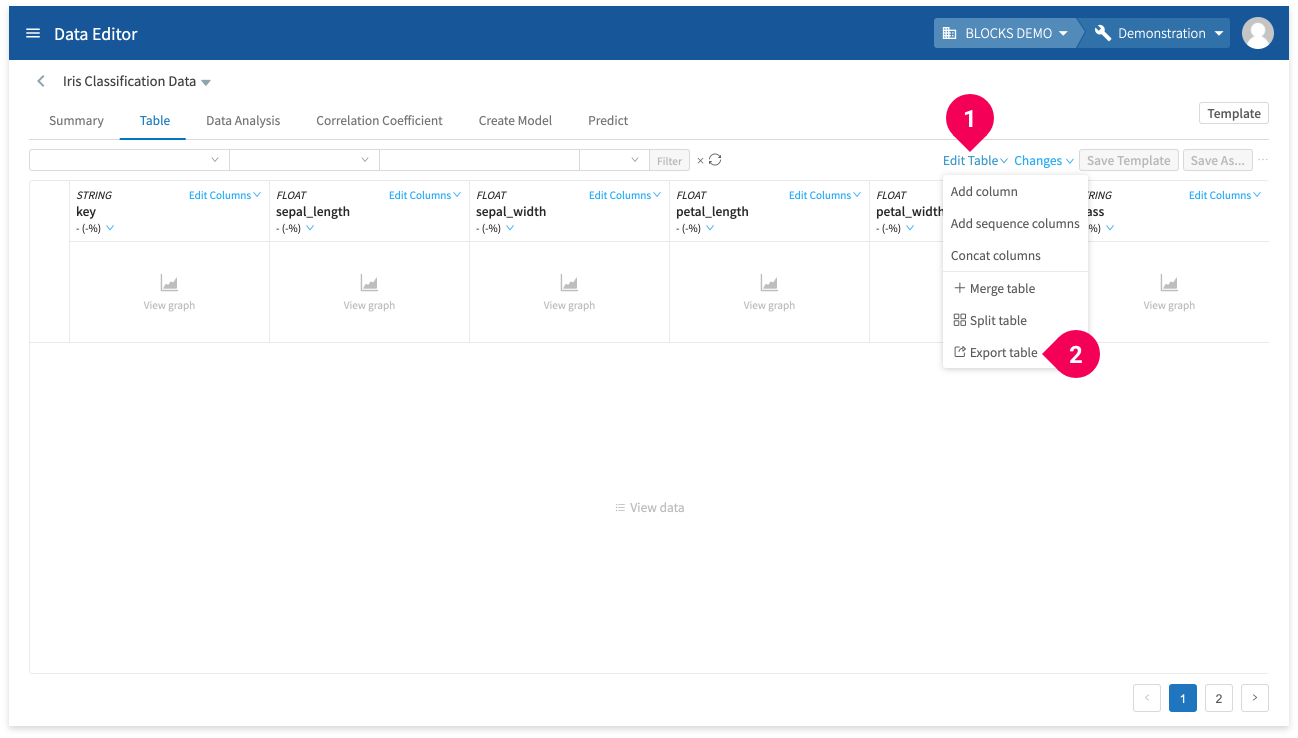
- Click Edit Table.
- Click Export table.
Copy schema info
You can copy schema info (JSON) for BigQuery to your clipboard. You can use this in the Schema settings property of BigQuery BLOCKS in the Flow Designer.
Delete data
You can delete your data from the DataEditor.
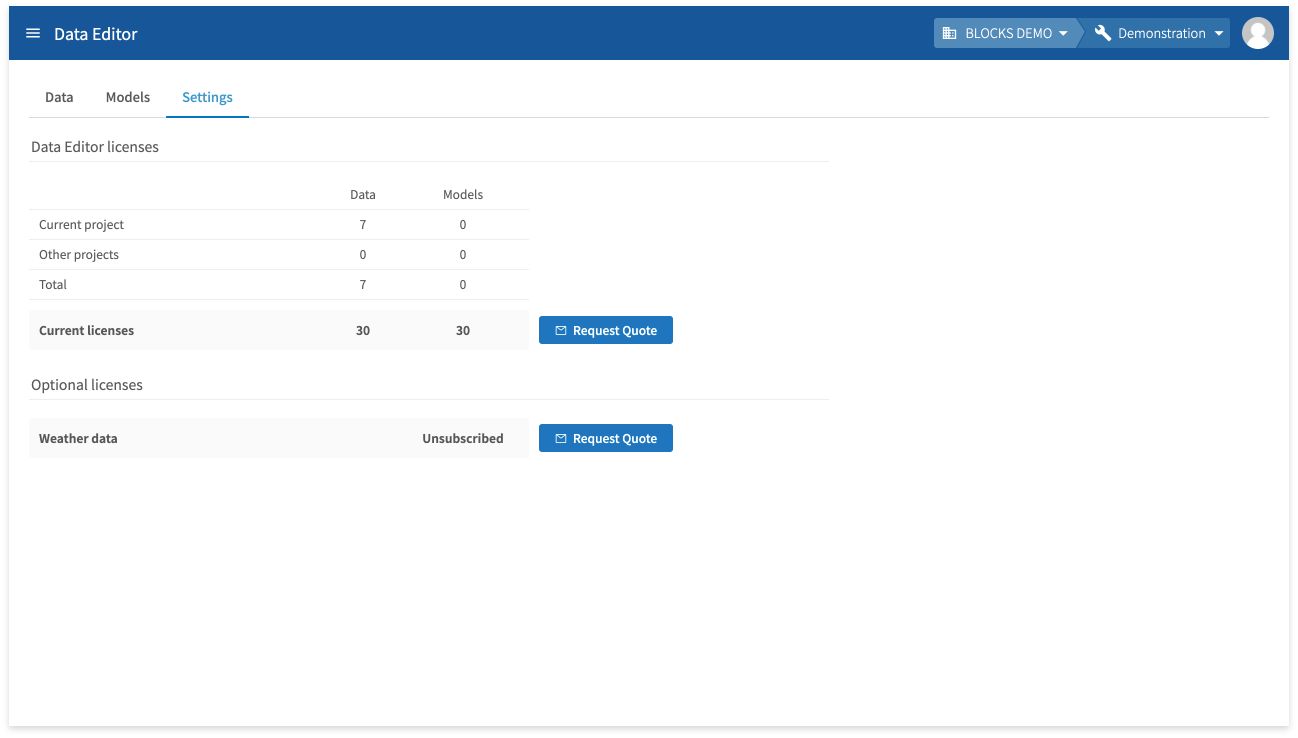
Settings
You can view information about your DataEditor licenses from the Settings tab. You can also request a quote for additional licenses or optional licenses.