Screen layouts
Flow Designer
The following image shows the layout of the Flow Designer.
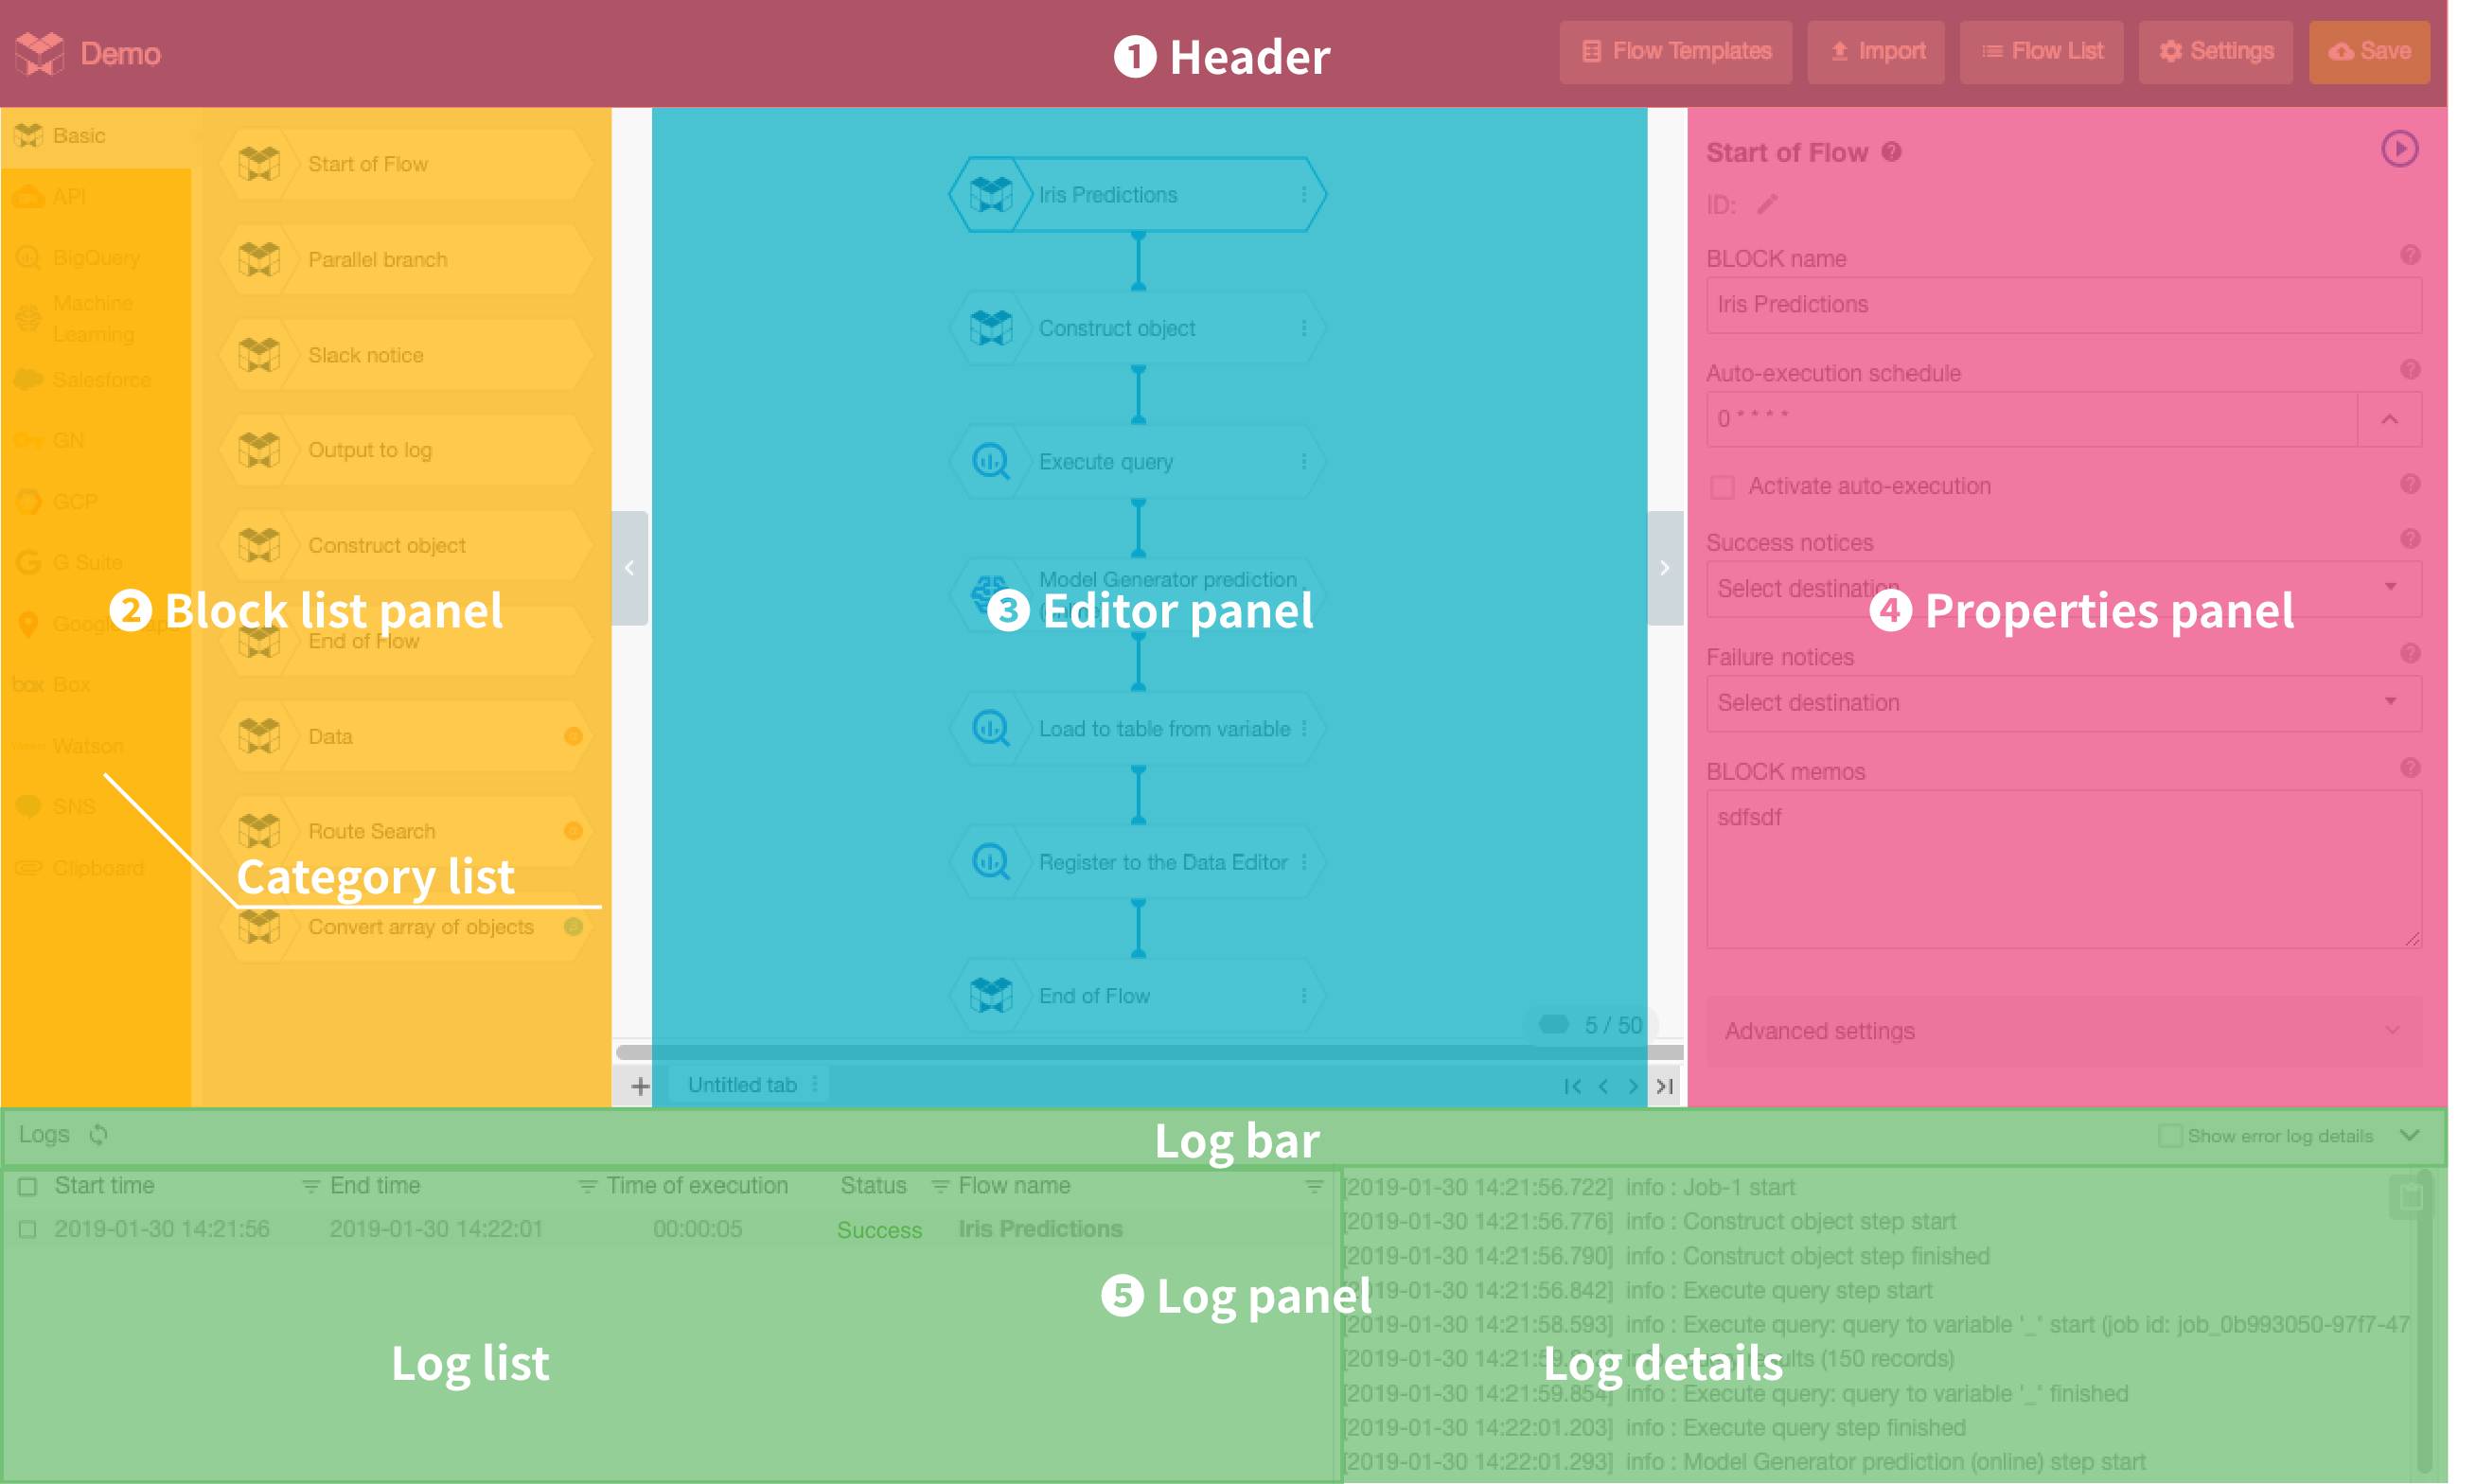
The Flow Designer screen consists of five parts: the header, BLOCK list panel, editor panel, properties panel, and log panel.
Header
The header contains the following items:
| Item | Explanation |
|---|---|
| Flow Designer name | Shows the name of the Flow Designer. |
| Import button | Import Flows into your Flow Designer from JSON files. |
| Flow list button | Shows a list of all Flows within the Flow Designer. You can also enable or disable auto-execution schedules, set IDs, and export JSON files for each Flow. |
| Settings button |
You can do the following from the settings menu:
|
| Save button | Save the Flows you have created or edited. |
BLOCK list panel
Select the BLOCKS to use in your Flows from the BLOCK list. BLOCKS are separated into categories.
| Section | Explanation |
|---|---|
| Category list |
BLOCKS are organized by type in the Category list. For example, BLOCKS relating to BigQuery are in the BigQuery category, Salesforce-related BLOCKS are in the Salesforce category, and so on. Clicking a category will switch the BLOCK list portion to that category's BLOCKS. |
| BLOCK list |
Shows a list of BLOCKS based on the selected category. Drag and drop BLOCKS from the BLOCK list into the editor panel to use them. |
Editor panel
Place BLOCKS into the editor panel to create and edit Flows.
Properties panel
You can configure custom settings for BLOCKS in the properties panel.
The customizable settings differ for each BLOCK. Refer to the BLOCK Reference page for more details.
Log panel
You can view records of Flow executions in the log panel.
The log panel consists of three sections: the log bar, log list, and log details. Only the log bar will be shown when you first open a Flow Designer. Clicking the log bar brings up the log list and log details sections.
| Item | Explanation |
|---|---|
| Log bar | Click to display or hide the rest of the log panel. |
| Log list |
Displays a list of the status, start time, end time, and elapsed time for Flow executions. Each row shows information for one Flow execution. Clicking a row from the log list will bring up more information about it in the log details section. |
| Log details |
Shows details about a Flow execution. Click a row from the log list to show have its details displayed here. |